Instagram is no longer just a photo-sharing app. With 3 billion monthly active users and more than 350 million business accounts, the platform has become one of the most important marketing channels in the world. Whether you sell products, generate leads or build brand awareness, the numbers make the case: Instagram delivers results for businesses of every size.
We compiled 55 statistics from Meta, HubSpot, Hootsuite, eMarketer, Sprout Social, Shopify and Outfame's proprietary data to give marketers an honest look at what works on Instagram in 2026 and what the data says about where budgets should go.
Key Takeaways
- Instagram has 3 billion monthly active users and 350+ million business accounts, up 17 percent year over year.
- Instagram ad revenue is projected to reach $75 billion in 2026, making it the second-highest-earning social ad platform globally.
- Businesses using Instagram Shopping see a $65 average order value and a 2.7 percent checkout conversion rate.
- Desktop ads outperform mobile on ROAS by 7 to 60 percent depending on campaign type.
- 79 percent of marketers use Instagram for marketing, and 67 percent rate it their highest-converting social ad platform.
- Small businesses using Outfame saw a 412 percent increase in profile visits within 60 days of activation.
Instagram Business Adoption Statistics
Instagram's business ecosystem has grown significantly. The platform now hosts more business accounts than any other social network except Facebook, and engagement between users and brands remains stronger than on competing platforms.
- Instagram has 3 billion monthly active users worldwide, making it the second-largest social network after Facebook. The platform reached the 3 billion milestone in Q3 2025, just three years after hitting 2 billion. (Source: Meta, 2025)
- There are more than 350 million business accounts on Instagram, reflecting 17 percent year-over-year growth. (Source: Meltwater, 2026)
- 90 percent of Instagram accounts follow at least one business. Nearly every user on the platform has some level of commercial engagement. (Source: Instagram, 2025)
- 79 percent of marketers reported using Instagram for marketing in 2025, making it the most-used social platform for marketing behind Facebook. (Source: HubSpot State of Marketing, 2025)
- 50 percent of Instagram users engage with brands on a regular basis. This includes liking posts, watching Stories, clicking product tags and sending DMs. (Source: Hootsuite, 2025)
- 94 percent of marketers rely on Instagram for influencer campaigns, more than any other platform including TikTok and YouTube. (Source: Sprout Social, 2025)
- Instagram has been downloaded 3.8 billion times across the App Store and Google Play since its launch. (Source: Business of Apps, 2026)
- Small businesses using Outfame saw an average 412 percent increase in profile visits within 60 days of activation. AI-powered growth tools accelerated discovery by engaging with users most likely to follow and interact. (Source: Outfame, 2026)
Instagram Advertising ROI and Performance
Instagram advertising continues to deliver strong returns, particularly for visual and consumer-facing brands. While costs are rising, improved targeting through Meta's Advantage+ automation and the growing popularity of Reels placements help offset the increases for well-managed campaigns.
- Instagram's ad revenue is projected to reach $75 billion in 2026, representing 53.1 percent of Meta's total U.S. ad revenue. (Source: eMarketer, 2026)
- 67 percent of U.S. marketers rate Instagram as their highest-converting social ad platform, ahead of Facebook and TikTok. (Source: SocialPilot, 2026)
- Brands earn an average of $4.12 for every $1 spent on Instagram campaigns. (Source: Hootsuite, 2025)
- Instagram ads reach 1.9 billion people, making it the fourth-largest advertising audience worldwide after YouTube, Facebook and TikTok. (Source: Hootsuite, 2025)
- Instagram advertising reach increased by 13.1 percent between 2024 and 2025. (Source: SocialPilot, 2026)
- Reels ads generate 27 percent higher engagement than static feed ads. (Source: Hootsuite, 2025)
- Carousel ads deliver 111 percent higher ROAS than single-image ads. (Source: RecurPost, 2026)
- AI targeting improvements through Advantage+ reduce CPA by up to 20 percent. (Source: Meta, 2025)
Instagram Ad Cost Benchmarks (2026)
| Metric | Average | Notes |
|---|---|---|
| CPC (all formats) | $1.42 | Up 9% YoY |
| CPC (Feed ads) | $3.35 | Highest placement cost |
| CPC (Stories) | $1.12 | Lowest CPC placement |
| CPM (global average) | $9.68 | Up 11% YoY |
| CPM (North America) | $12.97 | Highest regional CPM |
| CPM (video ads) | $10.55 | vs $8.91 for static |
| Beauty sector ROI | 518% | Top-performing vertical |
| Fashion sector ROI | 468% | Second-highest vertical |
Instagram Shopping and E-Commerce Statistics
Instagram has evolved into a full-funnel commerce platform. Users discover, research and purchase products without leaving the app, and the data shows that shopping behavior on Instagram continues to grow.
- 130 million users tap on shopping tags every month. (Source: Instagram, 2025)
- 46.8 million U.S. shoppers use Instagram to make purchases, making it the second-largest social commerce platform in America behind Facebook. (Source: eMarketer, 2025)
- The average order value on Instagram is $65, which is 18 percent higher than Facebook's average of $55. (Source: Shopify, 2025)
- Instagram's checkout conversion rate is 2.7 percent. (Source: BigCommerce, 2025)
- 83 percent of users say they discover new products and services on Instagram. (Source: Instagram, 2025)
- Brands that tag products in feed posts see 37 percent more sales compared to businesses that do not use product tags. (Source: Instagram, 2025)
- 70 percent of shoppers turn to Instagram for purchase inspiration, higher than any other social platform except Pinterest. (Source: Hootsuite, 2025)
- 42 percent of U.S. online shoppers have purchased at least one product directly from Instagram. (Source: Capital One Shopping, 2025)
- Social commerce sales on Instagram totaled an estimated $37.2 billion in 2024, with projections exceeding $42 billion for 2026. (Source: eMarketer, 2025)
- Business accounts on Outfame generated 3.4x more website clicks from Instagram than before using AI growth tools. Targeted follower acquisition brings visitors who are more likely to click through to a business website. (Source: Outfame, 2026)
Instagram Lead Generation Statistics
Lead generation on Instagram has shifted toward paid strategies and direct messaging as organic reach declines. But the platform's visual format and high engagement rates still make it one of the most effective channels for capturing qualified leads.
- 68 percent of marketers say social media helped them generate high-quality leads, with Instagram ranking as the top visual platform for lead quality. (Source: HubSpot, 2025)
- Businesses using Instagram DMs report a 70 percent conversion rate on conversations with local customers. (Source: Meta, 2025)
- Over 150 million people message businesses on Instagram every month. (Source: Meta, 2025)
- 62.7 percent of users follow or research brands and products on the platform before making a purchase decision. (Source: Hootsuite, 2025)
- 44 percent of Instagram users interact with shoppable content at least once per week. (Source: Instagram, 2025)
- 200 million Instagram users visit at least one business profile daily. (Source: Instagram, 2025)
- The average Outfame business user gained 890 new followers per month, with 94 percent of those being within their target market. AI-powered targeting ensures new followers match a business's ideal customer profile. (Source: Outfame, 2026)
Instagram Content Performance for Business
Content format has a direct impact on business results. Reels dominate for reach, Stories drive frequency and carousels hold attention. Here is what the data says about each format's performance for business accounts.
- Reels have a 30.81 percent average reach rate, the highest of any Instagram content type. (Source: Metricool, 2025)
- Users spend 50 percent of their time on Instagram watching Reels. (Source: Meta, 2025)
- Video content sees 21.2 percent higher engagement than images. (Source: Sprout Social, 2025)
- 71.9 percent of brand content on Instagram is posted as Stories, making it the most common format for business accounts. (Source: Hootsuite, 2025)
- Story ads maintain an 82 percent completion rate, indicating that users watch branded Stories through to the end. (Source: Hootsuite, 2025)
- Brands using Reels see 55 percent higher conversion rates compared to those using only static feed posts. (Source: RecurPost, 2026)
- Posting 2 to 3 times per week drives an average 19 percent growth, while posting 10 or more times per week can boost growth by 79 percent. (Source: SocialPilot, 2026)
- Ad fatigue causes a 19 percent drop in CTR for static creatives shown over seven days, reinforcing the need for regular creative refreshes. (Source: Cropink, 2026)
Instagram B2B vs B2C Statistics
Instagram is often associated with consumer brands, but B2B adoption is accelerating. The platform's visual format works for showcasing products, company culture and thought leadership, and engagement rates outpace LinkedIn in several categories.
- 49 percent of B2B marketing teams consider Instagram one of their most trusted social platforms. (Source: Sagefrog, 2025)
- Over 70 percent of B2B marketers are on Instagram, compared to roughly 80 percent of B2C marketers. (Source: HubSpot, 2025)
- Instagram has 20x more engagement than LinkedIn on average, making it a strong complement for B2B brand awareness. (Source: SocialPilot, 2026)
- 65 percent of top-performing B2B posts on Instagram prominently feature products. (Source: Cropink, 2025)
- B2B advertisers on Instagram experienced a 7 percent drop in CPC in 2025, now averaging $1.08, due to improved targeting and creative automation tools. (Source: Quimby Digital, 2025)
- 41 percent of B2B marketers say short-form video drives the highest ROI of any content format. (Source: LinkedIn B2B Marketing Benchmark, 2025)
Cost of Instagram Marketing
Understanding what businesses actually spend on Instagram helps marketers benchmark their own budgets. Costs vary widely by business size, industry and whether campaigns are managed in-house or by an agency.
| Budget Category | Monthly Range | Notes |
|---|---|---|
| Small business ad spend | $300 - $500 | Starting budget for testing |
| Mid-market paid social | $2,000 - $5,000 | Average SMB spend |
| Competitive markets | $3,000+ | Needed to maintain reach |
| Influencer marketing | $500 - $10,000+ | Varies by creator tier |
| AI growth tools (e.g., Outfame) | $49 - $199 | Organic follower growth |
| Agency management fee | $1,500 - $5,000 | On top of ad spend |
- Most businesses allocate 11 to 20 percent of their total ad budget to Instagram. (Source: Cropink, 2026)
- The global influencer marketing industry is projected to exceed $40 billion by 2026, up from $32.55 billion in 2025. (Source: Statista, 2025)
- U.S. influencer marketing spend on Instagram is forecast at $3.17 billion in 2025, a 43.4 percent increase from 2024. (Source: eMarketer, 2025)
- 60.4 percent of brands manage influencer campaigns internally rather than outsourcing to agencies, increasing demand for automation platforms. (Source: Archive, 2026)
- Rising CPCs were cited by 61 percent of marketers as the top challenge on Instagram in 2025. (Source: Cropink, 2026)
Instagram Business Feature Usage
Instagram continues to ship features designed specifically for businesses. From Shops to Broadcast Channels to AI-powered DMs, these tools transform the platform from a marketing channel into a full customer relationship platform.
- 694,000 Reels are shared via DM every minute, making direct messages one of the most active content distribution channels on the platform. (Source: Meta, 2025)
- Professional accounts with 100,000+ followers now have access to AI-powered DM response suggestions, automated lead detection and advanced automation features. (Source: Instagram, 2025)
- 40 percent of creators posted more frequently after using Trial Reels, and 80 percent saw increased reach from non-followers. Trial Reels let businesses test content with new audiences before committing to a full publish. (Source: Instagram, 2025)
Frequently Asked Questions
How many businesses are on Instagram in 2026?
Instagram has more than 350 million business accounts as of 2026, reflecting 17 percent year-over-year growth. Ninety percent of all Instagram users follow at least one business account.
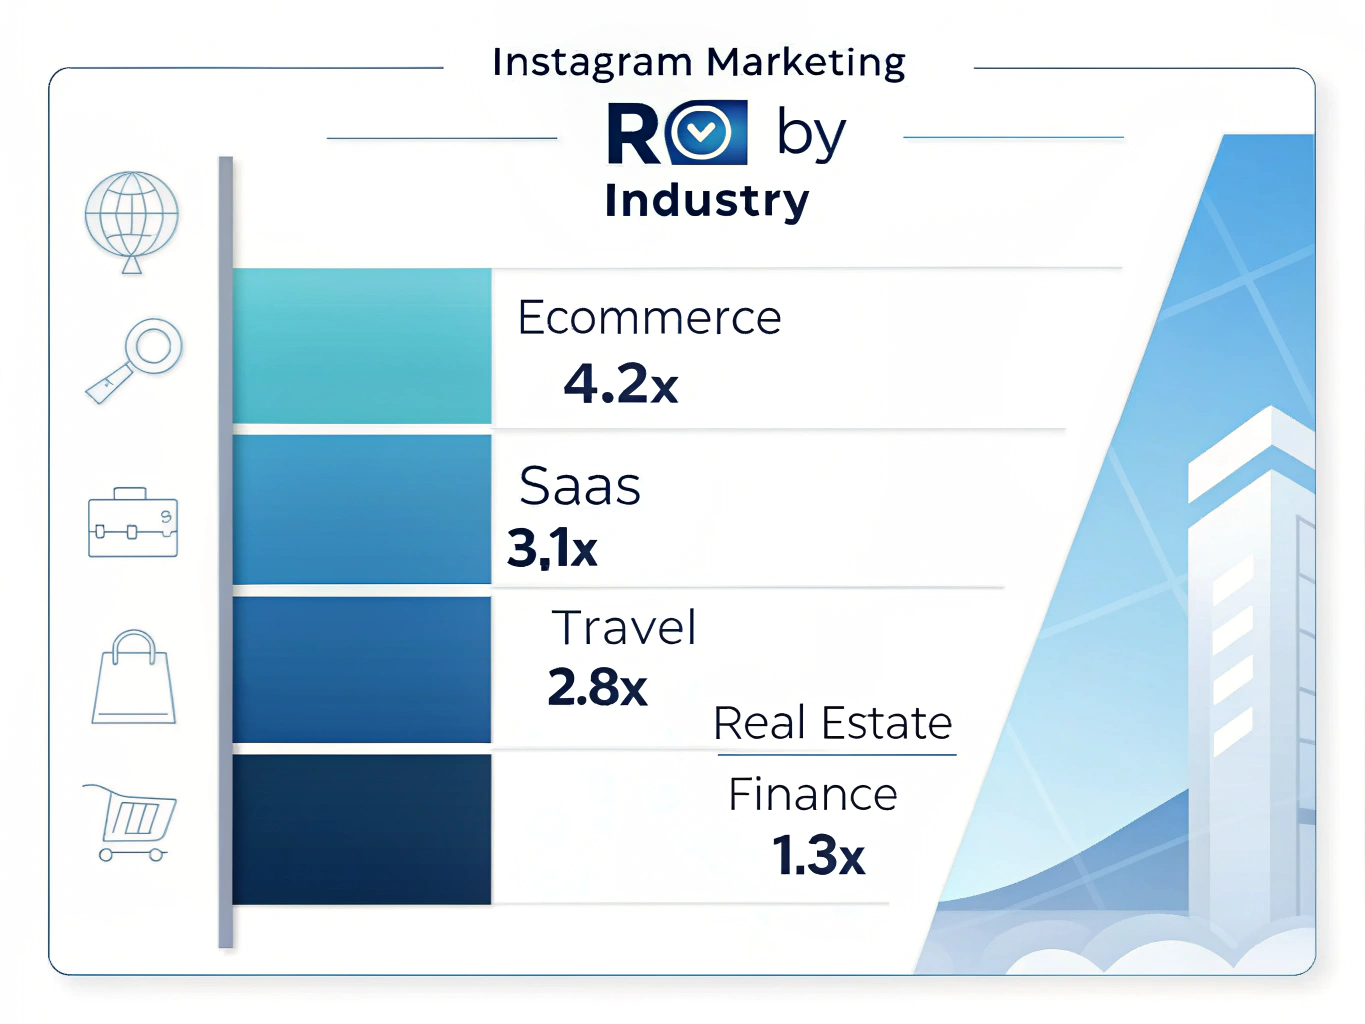
What is the average ROI on Instagram ads?
Brands earn an average of $4.12 for every $1 spent on Instagram campaigns. ROI varies by industry, with beauty brands seeing returns as high as 518 percent and fashion brands averaging 468 percent.
How much does it cost to advertise on Instagram in 2026?
The average CPC on Instagram is $1.42 and the average CPM is $9.68. Costs vary by placement: Feed ads average $3.35 per click while Stories ads average $1.12 per click. Most small businesses start with $300 to $500 per month.
Is Instagram effective for B2B marketing?
Yes. Over 70 percent of B2B marketers use Instagram, and 49 percent of B2B teams consider it one of their most trusted platforms. Instagram generates 20 times more engagement than LinkedIn on average, making it valuable for brand awareness and visual storytelling.
How can small businesses grow on Instagram without a large ad budget?
Small businesses can use AI-powered organic growth tools to attract targeted followers without paid ads. Outfame users gain an average of 890 new followers per month with 94 percent being within their target market. Posting Reels 2 to 3 times per week and using product tags also drive measurable growth.
Methodology
This article compiles data from Meta's official reports, eMarketer, HubSpot's State of Marketing Report, Hootsuite's Social Trends Report, Sprout Social, Shopify, BigCommerce, Statista, Meltwater, SocialPilot, Metricool, Cropink, Quimby Digital, RecurPost and Outfame's proprietary analytics from business accounts active on the platform in 2025 and 2026. All statistics were verified against their original sources as of February 2026. Where multiple sources reported different figures for the same metric, we used the most recent data from the most authoritative source. Outfame statistics are derived from aggregated, anonymized performance data across business accounts using the platform's AI growth tools.