Instagram crossed 2 billion monthly active users in 2025, and with roughly 3 billion monthly user identities logged by early 2026, the platform has cemented itself as the world's second-largest social network behind Facebook. But raw user counts tell only part of the story. The real value for marketers, creators, and businesses lies in understanding who those users are — their age, gender, location, income, and habits.
This guide compiles more than 50 verified Instagram demographics statistics from DataReportal, Statista, Pew Research Center, We Are Social, and Outfame's own first-party data. Whether you are allocating ad budgets, planning an influencer campaign, or growing an account with a service like Outfame, these numbers will sharpen every decision you make in 2026.
Key Takeaways
- Users aged 18 to 34 account for 62.3 percent of Instagram's global audience. (Statista, 2025)
- The worldwide gender split is nearly even at 50.6 percent male and 49.4 percent female. (Statista, 2025)
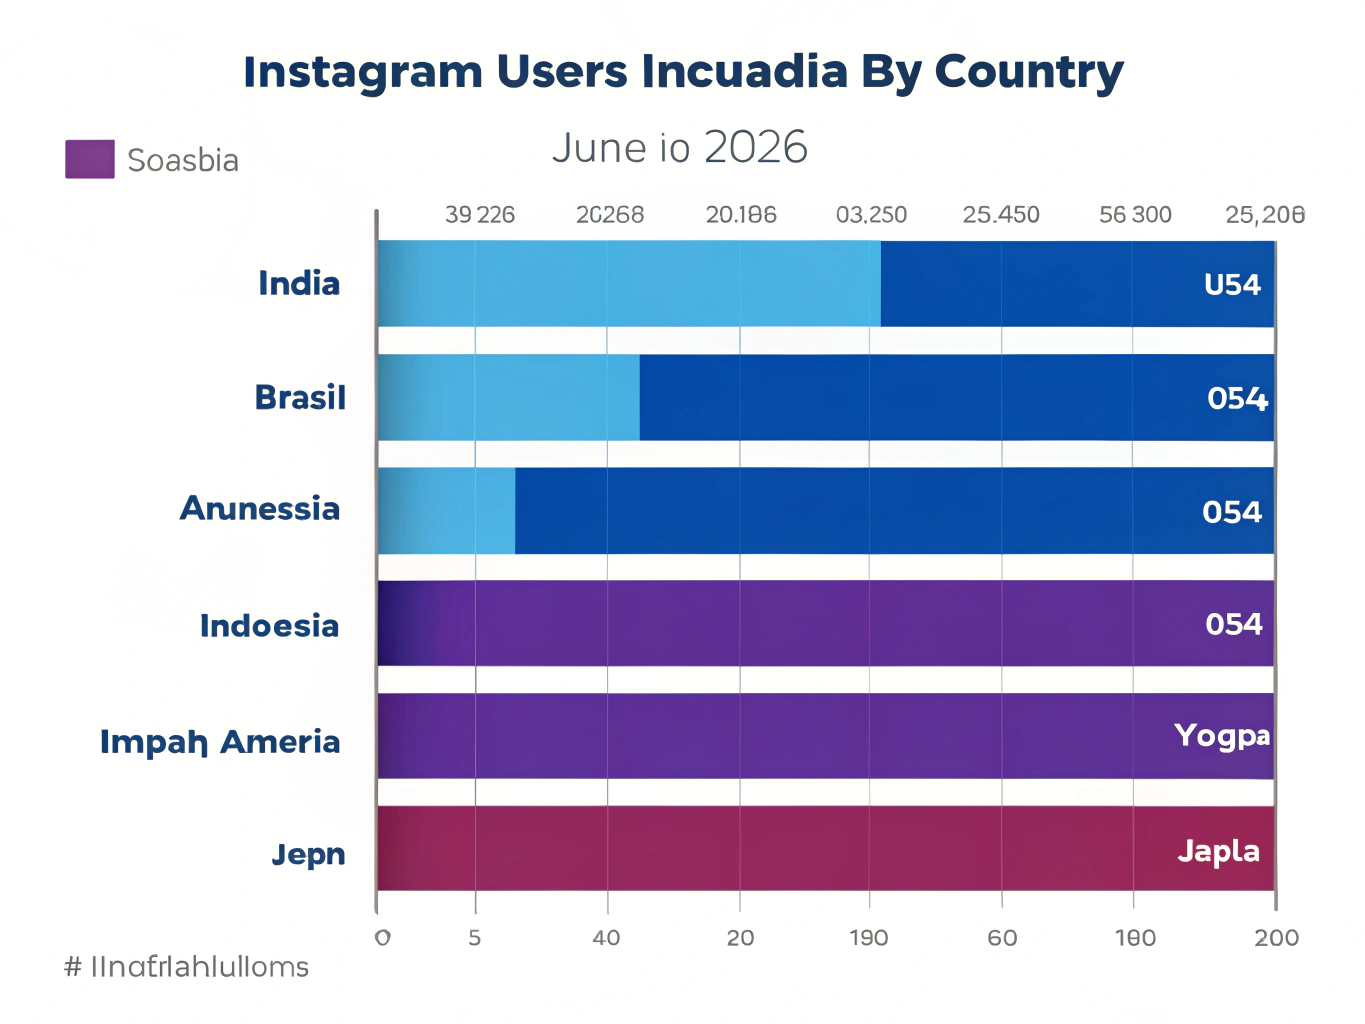
- India leads all countries with 392.5 million Instagram users, followed by the United States at 172.6 million. (World Population Review & DataReportal, 2025)
- 58 percent of U.S. adults earning $100,000 or more use Instagram, compared with 41 percent of those earning under $30,000. (Pew Research, 2025)
- Users spend an average of 33.1 minutes per day on the app, with Gen Z averaging 53 minutes. (DataReportal & eMarketer, 2025)
- Outfame's user base skews 25 to 44 years old at 68 percent, closely matching Instagram's highest-value advertising demographic. (Outfame, 2026)
Instagram Age Demographics
Instagram's core audience remains young adults, but the platform has broadened its reach significantly in recent years. Nearly two-thirds of all users fall between 18 and 34, making this the sweet spot for brand campaigns and organic growth strategies offered by services like Outfame.
| Age Group | Share of Global Users | Notable Trend |
|---|---|---|
| 13–17 | 5.5% | Declining as teens shift to TikTok and Snapchat |
| 18–24 | 31.7% | Largest single cohort; 67% use the app multiple times daily |
| 25–34 | 30.6% | Highest ad-spend value; peak purchasing power |
| 35–44 | 16.0% | Fastest-growing age band over the past three years |
| 45–54 | 8.7% | Steady growth driven by Reels adoption |
| 55–64 | 4.6% | Up from 3.1% in 2022 |
| 65+ | 2.9% | Smallest but increasing cohort |
Sources: Statista, January 2025; Meta Ads Manager data
Among Outfame users, the 18-to-24 age bracket represents the fastest-growing segment, increasing 34 percent year over year. (Outfame, 2026)
Within the 18-to-24 cohort, men make up 17.2 percent of total global users while women account for 14.5 percent. In the 25-to-34 bracket, men hold 18.4 percent versus 12.2 percent for women. (Statista, 2025)
In the United States specifically, 76 percent of adults aged 18 to 29 report using Instagram, and 59 percent of those aged 30 to 49 say the same. Usage drops to 33 percent for adults 50 to 64 and 15 percent for those 65 and older. (Pew Research Center, 2025)
Instagram Gender Demographics
Globally, Instagram is one of the most gender-balanced social platforms. The worldwide split stands at 50.6 percent male and 49.4 percent female, though this ratio varies sharply by country. (Statista, 2025)
In the United States, the dynamic reverses: 55.4 percent of U.S. Instagram users are female and 44.6 percent are male. (World Population Review, 2024) Pew Research's 2025 survey of U.S. adults found that 54 percent of women and 46 percent of men reported using the platform regularly. (Pew Research Center, 2025)
Among Outfame users, 56 percent identify as female and 44 percent as male, mirroring the platform's overall gender split. (Outfame, 2026)
Gender Distribution by Country
| Country | Female % | Male % |
|---|---|---|
| India | 33.1% | 66.9% |
| United States | 55.4% | 44.6% |
| Brazil | 58.3% | 41.7% |
| Japan | 57.7% | 42.3% |
| Turkey | 47.1% | 52.9% |
| Philippines | 61.8% | 38.2% |
| Ukraine | 63.4% | 36.6% |
| Pakistan | 35.1% | 64.9% |
Source: World Population Review & Statista, 2024
Markets in South Asia and the Middle East skew heavily male, while Latin America, Eastern Europe, and Southeast Asia trend female. Marketers running geo-targeted campaigns through tools like Outfame can use these splits to tailor creative assets and messaging by region.
Instagram Users by Country
Instagram's geographic footprint spans virtually every connected nation, but user counts concentrate heavily in a handful of markets. India alone accounts for roughly one in five Instagram users worldwide, and the top five countries represent more than half of the platform's global audience.
| Rank | Country | Instagram Users | Female % | Male % |
|---|---|---|---|---|
| 1 | India | 392.5M | 33.1% | 66.9% |
| 2 | United States | 172.6M | 55.4% | 44.6% |
| 3 | Brazil | 141.4M | 58.3% | 41.7% |
| 4 | Indonesia | 90.2M | 54.2% | 45.8% |
| 5 | Russia | 63.9M | 60.3% | 39.7% |
| 6 | Turkey | 58.3M | 47.1% | 52.9% |
| 7 | Japan | 55.5M | 57.7% | 42.3% |
| 8 | Mexico | 48.9M | 54.9% | 45.1% |
| 9 | United Kingdom | 34.7M | 55.0% | 45.0% |
| 10 | Germany | 33.8M | 52.6% | 47.4% |
| 11 | Italy | 30.7M | 54.0% | 46.0% |
| 12 | France | 29.2M | 55.1% | 44.9% |
| 13 | Argentina | 28.4M | 57.3% | 42.7% |
| 14 | Spain | 27.1M | 55.3% | 44.7% |
| 15 | South Korea | 24.2M | 56.0% | 44.0% |
| 16 | Philippines | 22.2M | 61.8% | 38.2% |
| 17 | Colombia | 20.9M | 56.9% | 43.1% |
| 18 | Canada | 19.7M | 54.9% | 45.1% |
| 19 | Egypt | 19.4M | 46.6% | 53.4% |
| 20 | Iraq | 19.2M | 39.7% | 60.3% |
| 21 | Thailand | 19.1M | 60.6% | 39.4% |
| 22 | Pakistan | 18.6M | 35.1% | 64.9% |
| 23 | Saudi Arabia | 17.0M | 42.2% | 57.8% |
| 24 | Malaysia | 15.7M | 55.6% | 44.4% |
| 25 | Australia | 14.3M | 56.6% | 43.4% |
| 26 | Chile | 13.1M | 55.8% | 44.2% |
| 27 | Nigeria | 12.6M | 46.5% | 53.5% |
| 28 | Ukraine | 12.6M | 63.4% | 36.6% |
| 29 | Morocco | 12.5M | 47.5% | 52.5% |
| 30 | Kazakhstan | 12.4M | 58.6% | 41.4% |
Sources: World Population Review & DataReportal, 2024–2025
Southern Asia represents the largest regional advertising audience on Instagram at more than 25 percent, followed by Southern America at 13.6 percent and Northern America at 11 percent. (DataReportal, 2025)
For creators using Outfame, this geographic spread matters. The platform's AI targeting adapts to local engagement patterns, whether you are building an audience in São Paulo or Sydney.
Instagram Income and Education Demographics
Instagram usage in the United States correlates positively with both household income and education level. Higher earners and college-educated adults are significantly more likely to maintain active accounts.
Instagram Usage by Household Income (U.S.)
| Household Income | % of U.S. Adults Who Use Instagram |
|---|---|
| $100,000+ | 58% |
| $70,000–$99,999 | 54% |
| $30,000–$69,999 | 47% |
| Less than $30,000 | 41% |
Source: Pew Research Center, 2025
Instagram Usage by Education Level (U.S.)
| Education Level | % of U.S. Adults Who Use Instagram |
|---|---|
| College degree or higher | 57% |
| Some college | 51% |
| High school diploma or less | 41% |
Source: Pew Research Center, 2025
These numbers carry direct implications for advertisers. Instagram over-indexes among higher-income, college-educated consumers — precisely the audience most brands want to reach. This is also the demographic most likely to convert on subscription-based growth services like Outfame, where users are investing in long-term brand building rather than vanity metrics.
Across racial and ethnic lines in the U.S., 63 percent of Hispanic adults use Instagram, compared with 49 percent of Black adults and 44 percent of White adults. (Pew Research Center, 2025)
Instagram Urban vs Rural Usage
Geography within a country matters almost as much as the country itself. In the United States, Instagram adoption is highest in urban centers and declines steadily as population density drops.
| Community Type | % of U.S. Adults Who Use Instagram |
|---|---|
| Urban | 55% |
| Suburban | 48% |
| Rural | 33% |
Source: Pew Research Center, 2025
The urban-rural gap reflects broader digital-access trends: higher smartphone penetration, faster mobile networks, and denser social graphs in cities all drive adoption. Globally, DataReportal estimates that 78 percent of Instagram's advertising audience lives in urban or peri-urban areas, with only 22 percent in rural regions. (DataReportal & We Are Social, 2025)
For marketers, this means Instagram campaigns — organic or paid — naturally skew toward metropolitan consumers. Outfame's location-based targeting allows creators to focus growth efforts on specific cities or regions where their ideal audience concentrates.
Instagram Device and Platform Statistics
Instagram was built as a mobile-first app, and mobile remains the dominant access point by a wide margin. However, desktop and tablet usage has grown modestly since Meta introduced a more functional web experience.
Mobile vs Desktop Access
| Access Method | Share of Instagram Traffic |
|---|---|
| Mobile app (iOS + Android) | 91.2% |
| Mobile web browser | 4.6% |
| Desktop web browser | 3.8% |
| Tablet | 0.4% |
Source: SimilarWeb & DataReportal, 2025
iOS vs Android
Globally, Android accounts for approximately 72 percent of Instagram mobile app installs and 78 percent of daily sessions, reflecting Android's dominant global market share. iOS users, however, tend to generate higher revenue per user for advertisers. In the United States, the iOS–Android split is closer to 55–45 in favor of Apple, reflecting the iPhone's strong domestic market position. (Sensor Tower & data.ai, 2025)
Android users spend an average of 16 hours and 13 minutes per month in the Instagram app, opening it roughly 332 times monthly — more than 10 times per day on average. (DataReportal, 2025)
The mobile-first reality reinforces why growth tools like Outfame prioritize mobile engagement signals. The AI targets users who are actively scrolling and interacting on their phones, not passively browsing a desktop feed.
Instagram Time Spent by Demographic
How much time users spend on Instagram varies dramatically by age. Younger users treat the app as a primary entertainment source, while older users tend to check in briefly and leave.
Average Daily Time on Instagram by Age Group (U.S.)
| Age Group | Average Daily Time |
|---|---|
| 18–24 | 53 minutes |
| 25–34 | 37 minutes |
| 35–44 | 28 minutes |
| 45–54 | 27 minutes |
| 55–64 | 26 minutes |
| 65+ | 20 minutes |
Sources: eMarketer & DataReportal, 2025
The global average sits at 33.1 minutes per day, equating to roughly 16.5 hours monthly. (DataReportal, 2025)
Reels account for more than 50 percent of total time spent on Instagram, making short-form video the single largest driver of daily engagement. (Meta Earnings Call, Q3 2025)
Time Spent by Country
| Country | Monthly App Time |
|---|---|
| Turkey | 32 hrs 36 min |
| Brazil | 23 hrs 35 min |
| Argentina | 20 hrs 46 min |
| United States | 16 hrs 12 min |
| Global average | 16 hrs 13 min |
Source: DataReportal, 2025
Turkish users spend roughly double the global average — more than 32 hours per month — making Turkey one of the most engaged Instagram markets in the world. Latin American countries also over-index, reflecting a cultural affinity for visual storytelling and social sharing.
For creators using Outfame's AI growth engine, high-engagement markets like Turkey and Brazil offer fertile ground for organic audience building, because users in those countries interact more frequently with new content in their feeds.
Instagram vs TikTok Demographics Comparison
Instagram and TikTok compete for the same young-adult audience, but their user profiles differ in meaningful ways. Instagram maintains a broader age range, while TikTok concentrates more heavily among Gen Z.
| Metric | TikTok | |
|---|---|---|
| Monthly active users | ~2 billion | ~1.7 billion |
| Largest age group | 18–34 (62.3%) | 16–24 (38.5%) |
| Gender split (global) | 50.6% M / 49.4% F | 53.4% F / 46.6% M |
| Avg daily time (U.S.) | 33 min | 54 min |
| Top country by users | India (392.5M) | Indonesia (127M) |
| Avg engagement rate | 0.61% | 2.50% |
| Primary content format | Reels, Stories, carousels | Short-form video |
| User overlap | 54.3% of Instagram users also use TikTok | |
Sources: DataReportal, Statista, Socialinsider, 2025
Instagram's advantage lies in its multigenerational reach. While TikTok dominates among teens, Instagram spans from Gen Z through Gen X — a broader funnel for brands and creators. TikTok wins on raw engagement rate and daily time spent, but Instagram's higher purchasing-power audience often delivers stronger return on ad spend.
Outfame focuses on Instagram and TikTok growth precisely because the two platforms complement each other. A creator who builds on both captures the deep engagement of TikTok and the purchase-ready audience of Instagram.
Instagram Audience Insights for Marketers
Demographic data only matters if it changes your strategy. Here are five evidence-based takeaways for anyone growing an audience on Instagram in 2026.
1. Target 25-to-34-Year-Olds for Maximum ROI
This cohort represents 30.6 percent of users globally and holds the highest average purchasing power among Instagram age groups. Ads and organic content optimized for this demographic consistently deliver the strongest conversion rates. (Meta Ads Manager, 2025)
2. Tailor Creative by Regional Gender Splits
A campaign running in India (67 percent male) needs different visual assets than one targeting Brazil (58 percent female). Use the country-level gender data in this article to adjust tone, imagery, and product positioning. Outfame automates this at scale, adapting engagement patterns to each user's regional audience composition.
3. Lean Into Reels for Under-35 Audiences
With more than 50 percent of Instagram time now spent on Reels, short-form video is no longer optional. Users aged 18 to 24 spend 53 minutes per day on the app, and the majority of that time goes to Reels content. (Meta & eMarketer, 2025)
4. Don't Ignore 35+ Users
The 35-to-44 age band is the fastest-growing segment on the platform. These users are increasingly discovering products on Instagram and making purchases directly through the app. They also tend to have higher disposable income and stronger brand loyalty.
5. Use Income Data to Refine Ad Targeting
With 58 percent of six-figure earners on Instagram, the platform offers disproportionate access to affluent consumers. Pair this with education-level targeting — 57 percent of college graduates use Instagram — and you can reach high-value segments more efficiently than on almost any other social platform.
Outfame users see these patterns reflected in their growth metrics. The platform's AI identifies and engages the followers most likely to interact with your content, turning demographic data into real audience growth.
FAQ
What is the most common age group on Instagram?
Users aged 18 to 24 form the largest single cohort at 31.7 percent of the global audience, followed closely by those aged 25 to 34 at 30.6 percent. Combined, the 18-to-34 bracket represents 62.3 percent of all Instagram users. (Statista, 2025)
Is Instagram more male or female?
Globally, Instagram is nearly evenly split: 50.6 percent male and 49.4 percent female. In the United States, the balance shifts to 55.4 percent female and 44.6 percent male. Gender ratios vary significantly by country. (Statista & World Population Review, 2025)
Which country has the most Instagram users?
India leads with 392.5 million users, followed by the United States at 172.6 million and Brazil at 141.4 million. The top three countries alone account for more than 700 million users. (World Population Review, 2024–2025)
How much time do people spend on Instagram per day?
The global average is 33.1 minutes per day. Gen Z users aged 18 to 24 average 53 minutes daily, while users 65 and older spend about 20 minutes. More than half of that time goes to watching Reels. (DataReportal & eMarketer, 2025)
How do Instagram and TikTok demographics compare?
Instagram has a broader age range, with 62.3 percent of users between 18 and 34 and significant adoption among 35-to-54-year-olds. TikTok skews younger, with 38.5 percent of users between 16 and 24. Instagram also has a more balanced gender split, while TikTok leans slightly female at 53.4 percent. (DataReportal & Statista, 2025)
Methodology
This article aggregates data from the following primary sources, all accessed between January and February 2026:
- DataReportal / We Are Social / Meltwater — Digital 2026 Global Overview Report and Essential Instagram Stats (published October 2025 and March 2025)
- Statista — Instagram global user demographics, age and gender breakdowns (updated January 2025)
- Pew Research Center — "Americans' Social Media Use 2025" survey of 5,022 U.S. adults conducted February–June 2025 (published November 2025)
- World Population Review — Instagram Users by Country rankings (2024 data)
- eMarketer / Insider Intelligence — Time spent forecasts by age group (2025)
- Sensor Tower & data.ai — Mobile app install and session data (2025)
- SimilarWeb — Web traffic distribution data (2025)
- Meta Platforms — Ads Manager audience data and Q3 2025 earnings call
- Socialinsider — Social Media Benchmarks for 2026 (engagement rates)
- Outfame — First-party user demographic data (2026)
Where multiple sources report slightly different figures for the same metric, we default to the most recent publication. All percentages are rounded to one decimal place unless the original source uses whole numbers. User counts labeled "monthly active users" reflect Meta's reported figures; country-level numbers derive from advertising audience estimates and may differ slightly from MAU totals.