
Follower count can mislead you fast. For a U.S. campaign, I’d rank a creator by qualified reach, not raw audience size: median reach/views × U.S. audience share × target-age share.
Here’s the short version:
- I compare creators on 4 checks: engagement, audience fit, growth quality, and campaign fit
- On Instagram, I put more weight on saves, shares, Story views, and comment quality
- On TikTok, I care more about views, watch time, completion rate, shares, and consistency across recent videos
- For nano and micro creators, I look harder at niche match, audience location, and comment depth
- For mid-tier and macro creators, I watch for audience drift, weak U.S. reach, and inflated follower counts
- I also check FTC disclosure readiness before I sign anything
A few numbers stand out:
- U.S. creator ad spend was projected to hit $37 billion in 2025
- A 25%+ fake-follower rate is a clear warning sign
- On macro Instagram accounts, Story views around 3%–7% of followers can help show whether the audience is active
- On TikTok, I judge performance from the last 10–15 videos, not one viral outlier
How to Spot Fake Influencers Like a Pro in 2025
sbb-itb-3b12fba
Quick Comparison
| What I check | TikTok | Nano/Micro | Mid-Tier/Macro | |
|---|---|---|---|---|
| Main reach signal | Followers + reach | Views + reach | Niche audience match | Scale plus market match |
| Main engagement signal | Saves, shares, comments, Story views | Shares, comments, watch time, completion | Comment depth and steady response | Median performance across recent posts |
| Main audience check | U.S. share, age, interests | U.S. share, age, language | Tight fit with buyer profile | Drift outside target market |
| Main warning sign | Follower spikes, weak Story views | High followers with low views | Giveaway-heavy engagement | Big audience but weak qualified reach |
| Best use | Visual proof, product demos, retargeting support | Discovery and reach | Seeding, UGC, niche sales | Awareness and larger launches |
If I had to sum up the whole guide in one line, it would be this: the best influencer is the one with the strongest audience match and the best recent performance for your goal - not the biggest follower count.
1. Instagram Influencers
Instagram audiences are usually easier to check than TikTok audiences because you can learn a lot from profile data and Story behavior.
Engagement Quality
Start by measuring engagement across the most recent 10–20 posts: (likes + comments + saves + shares) ÷ followers × 100. Saves and shares matter a lot here. They show that people didn’t just scroll by. They found the post worth coming back to or sending to someone else.
Then look at comment quality. Good comments are specific and tied to the post. They’re not just emojis or vague praise. Real audience members tend to ask questions, share their own experience, or react to something concrete in the content.
Audience Fit
Next, ask for audience data that shows top countries, age ranges, gender, language, and interests. Then compare that with your actual customer base. A creator may post strong content and still be a poor match if most followers live outside your service area or fall into the wrong age group.
Authenticity Signals
After that, review follower growth over at least six months. A sudden spike in growth with no clear reason is worth a closer look. Also watch for sharp follower jumps, high fake-follower estimates, and weak Story views. Story views compared with follower count can help you spot an audience that looks big on paper but isn’t very active.
Campaign Fit
Last, line up the creator with what the campaign is supposed to do.
- For awareness, focus on Reel reach, video completion, and coverage in your target market.
- For consideration, check saves, shares, comments, profile visits, and link clicks.
- For conversions, ask for proof of trackable link clicks, coupon-code redemptions, or affiliate sales from past brand deals.
Before you sign anything, make sure the creator can produce the content formats you need, will disclose the brand relationship in a clear way, and is open to granting any usage rights your campaign calls for. Put deliverables, approvals, and reporting deadlines in writing.
Use this quick comparison to judge Instagram audience quality at a glance.
| Criterion | Strong signal | Concern |
|---|---|---|
| Engagement quality | Relevant comments, saves, shares | Generic comments, engagement spikes |
| Audience fit | Target country, age, and market aligned | Outside target market or age range |
| Authenticity | Gradual growth, consistent Story views | Sudden spikes, weak Story views |
| Campaign fit | Prior category experience, measurable results | No relevant history, unclear metrics |
The same checks apply on TikTok, but the signals look different because discovery and audience mix work differently there.
2. TikTok Influencers
TikTok doesn’t work like Instagram. Its algorithm can put a video in front of people who don’t follow the creator at all. That’s why views matter more than follower count when you’re judging reach. Use the same four-part framework as Instagram, but put more weight on views and completion rate. A creator with strong recent views and lots of shares can beat a much larger account that gets weak interaction.
Engagement Quality
Look at the creator’s 10–15 most recent videos, not one big viral hit.
For TikTok, calculate engagement with:
((likes + comments + shares) ÷ views) × 100
Then compare both the average and the consistency across recent posts. Typical TikTok engagement usually lands around 3% to 8%. If it’s far above or below that range, take a closer look.
Put extra weight on shares, saves, meaningful comments, watch time, and completion rate. Those signals tell you more than passive likes. Also read a sample of 30 to 50 recent comments. Comments that mention the actual video are a strong sign. Generic replies like repeated emojis, “Nice,” or “Love this,” plus comments from empty accounts, are a red flag.
Audience Fit
Use the last 30 to 90 days of native analytics to check top countries, age ranges, gender, and language. If you’re running a U.S. campaign, make sure a meaningful share of the audience is actually in the United States and sits inside the product’s buying age range. Do that check before you decide a creator is a good fit.
Authenticity Signals
Review the follower-growth timeline over about 90 days. Sharp spikes that don’t match a viral video, media appearance, or collaboration can point to bought followers. Also check for follower-to-view gaps. For example, an account with 100,000 followers but only a few hundred views should make you pause. It also helps to manually scan some followers for empty profiles, spam-like usernames, or accounts with no posts.
Campaign Fit
Match the creator’s format and content style to what the campaign needs.
- For awareness, focus on completion rate.
- For consideration, look for meaningful comments and audience questions.
- For conversions, ask for proof of past clicks, promo-code use, or affiliate sales from earlier brand deals.
Before you lock anything in, confirm disclosure practices. Creators with paid or gifted partnerships need to disclose them clearly in the video or caption. Put deliverables, usage rights, Spark Ads permissions, deadlines, and reporting in writing.
| Criterion | Strong signal | Warning sign |
|---|---|---|
| Engagement quality | Consistent interaction; meaningful comments, shares, saves | One viral outlier; engagement almost entirely in likes |
| Views | Stable reach relative to the creator's normal range | Large follower count but consistently weak views |
| Audience fit | Target country, age, and language match the campaign | Genuine audience concentrated in irrelevant locations or age groups |
| Authenticity | Gradual growth, plausible follower profiles, contextual comments | Sudden unexplained spikes, bot-like profiles, generic comments |
| Campaign fit | Creator naturally fits the product category; can deliver clear calls to action | Forced sponsorships, inconsistent niche, or brand-safety concerns |
Once TikTok audience quality is clear, compare creators by size using the same checks.
3. Nano Creators
Nano creators usually have 1,000–10,000 followers. What makes them useful isn't raw reach. It's trust and tight niche alignment. Use the same four checks you'd use for Instagram and TikTok, but put more weight on audience fit and trust than on follower count.
At this level, a creator with 3,000 engaged followers in the right niche can beat someone with 20,000 followers who only have a loose tie to the topic.
Engagement Quality
Look at the last 10–20 posts. You're looking for steady engagement and comments that show real interest, not reactions pushed by giveaways. Benchmarks vary. On Instagram, strong nano engagement is often quoted around 3.5%–5%, and some sources put the range as high as 10%. Treat those numbers like a filter, not a goal.
The bigger clue is how people respond. Specific questions, product-use stories, and actual back-and-forth are much better signs than a high engagement rate made up of emoji-only comments or giveaway chatter.
Audience Fit
Ask for top countries, age ranges, and language data. A creator's location doesn't tell you where their audience lives. Someone based in the U.S. can still have most of their followers outside the U.S.
If the campaign is U.S.-only, make sure a solid share of the audience is in the United States and falls into the product's target age range. Strong engagement won't fix a bad audience match.
Authenticity Signals
Check follower growth over time. If you see a sharp jump with no clear reason - like a viral post, media mention, or collab - dig deeper. Then sample followers and look for warning signs: empty profiles, accounts with no posts, and usernames that look machine-made.
A 5%–15% fake-follower rate is common. Anything above 25% is a red flag. Small accounts can look fine at first glance and still be weak if growth came from giveaways or low-grade followers. Also check the post mix. If sponsored posts start to crowd out organic content, nano creators lose the trust edge that made them useful in the first place.
Campaign Fit
Once the audience checks out, line the creator up with the campaign goal. Nano creators tend to work best for local awareness, niche products, product seeding, UGC, and community-driven word of mouth.
Make sure the creator can handle the format you need - Reel, Story, carousel, or TikTok video. Before anything goes live, get the deliverables, usage rights, posting timeline, and disclosure rules in writing.
| Criterion | Strong signal | Warning sign |
|---|---|---|
| Engagement quality | Steady rate across recent posts; specific, contextual comments | Rate pushed by giveaways; mostly emoji reactions |
| Audience fit | Target country, age, and language match the campaign | U.S.-based creator, but audience is mostly international |
| Authenticity | Steady growth; 5%–15% fake followers; organic content mix | Sudden follower spikes; 25%+ fake followers; sponsored posts crowd out organic content |
| Campaign fit | Niche matches the product; creator can deliver the needed format, disclosure, and reporting | Creator can't deliver the needed format, disclosure, or reporting |
4. Micro Creators
Micro creators usually fall in the 10,000 to 100,000 follower range. They give you more reach than nano creators, but they can still keep a tighter audience than bigger accounts. At this level, the main thing to check is simple: does that extra reach still line up with your buyer profile?
Engagement Quality
Start by reviewing the last 10–20 posts. Then calculate engagement by dividing likes, comments, shares, and saves by followers or reach. For single-post analysis, use a reach-based rate. For public profile comparisons, use a follower-based rate.
On Instagram, micro creators have been benchmarked at about 3.86% engagement, compared with about 1.21% for mega influencers. On TikTok, the benchmark for this tier is about 8.7%.
Don’t compare Instagram and TikTok rates side by side. TikTok’s feed can push interaction rates higher than follower count alone would suggest.
Look at median performance, not one post that happened to blow up. Also split out organic content from giveaways, collaborations, and paid campaigns. The rate is just a filter. What matters more is whether the comments show actual interest or just giveaway chatter.
Comments that include product questions, personal use stories, or clear buying intent matter a lot more than a high rate built on emojis or contest traffic. On TikTok, ask for average watch time and completion rate too. A post with lots of views but weak retention often doesn’t do much for a campaign.
Audience Fit
As audience size grows, overlap and market concentration become a bigger deal. If you’re working with several creators, check for audience overlap first. If multiple accounts are reaching the same people, your extra reach starts to shrink.
Then dig into platform analytics:
- Top countries and cities
- Age ranges and gender
- Language and interests
For U.S. campaigns, make sure enough followers are in your target states or regions. A creator with 30,000 well-matched followers can beat one with 100,000 if the smaller audience is closer to your buyer profile.
Authenticity Signals
Check follower growth over time and flag sharp spikes that don’t make sense. Anything above 25% fake followers is a red flag, and accounts with 30%+ fake followers have shown 58% lower conversion rates.
It also helps to sample follower profiles by hand. Real accounts usually have a mix of usernames, profile photos, posting history, and interests that look believable. You should also check whether sponsored posts stay close to the creator’s normal content style and tone.
Campaign Fit
If the audience looks right, the next step is figuring out whether the creator can turn that match into results you can track.
| Criterion | Strong signal | Warning sign |
|---|---|---|
| Engagement quality | Steady rate across recent posts; specific, contextual comments | High rate driven by giveaways or emoji-only reactions |
| Audience fit | Target country, age, and language match the campaign | Creator is U.S.-based but audience is mostly international |
| Authenticity | Gradual growth; 5%–15% fake followers; organic content mix | Sudden follower spikes; 25%+ fake followers; repetitive or bot-like comments |
| Campaign fit | Niche matches the product; creator can deliver the required format and reporting | Creator can't produce the needed format, disclose properly, or provide analytics |
Look at past sponsored posts for clicks, saves, comments, conversions, or sales - not just impressions. Before you sign anything, make sure the creator can deliver the exact format you need, whether that’s a Reel, carousel, Story, TikTok video, or Spark Ad.
For Instagram, confirm whether you need partnership ad or whitelisting permissions. Put the details in writing, including:
- Deliverables
- Usage rights
- Posting dates
- Tracking links or discount codes
- Platform-specific permissions
5. Mid-Tier Creators
Mid-tier creators usually sit in the 50,000–500,000 follower range. At this level, a bigger audience helps, but it doesn't tell the whole story. Audience match and steady performance matter more than raw follower count. A creator with 120,000 well-matched U.S. followers can beat someone with 400,000 followers who are loosely matched or inactive.
Engagement Quality
At the mid-tier level, audience quality comes down more to consistency and relevance than to one-off spikes. Look at 10–20 comparable posts, separate organic content from sponsored content, and compare performance against others in the same tier. A 2025 benchmark puts typical Instagram mid-tier engagement at about 1.5%–3%. If the rate is lower, that isn't always a problem, especially if it lines up with the platform and niche.
The bigger issue is what's behind the number. Saves, shares, meaningful comments, profile visits, and link clicks point to real interest. A pile of random emojis or comment bursts from unrelated accounts doesn't. On TikTok, check median views, completion rate, shares, rewatches, and how steady the last 10–20 comparable videos look.
Audience Fit
Ask for current analytics that show top countries and cities, age, gender, language, and interests. Then verify audience location yourself. As a practical floor, 70% audience match is a solid benchmark when the analytics back it up.
Once the audience looks like a fit, the next step is simple: make sure the growth behind it looks real.
Authenticity Signals
Watch for follower spikes that don't have a clear reason behind them, especially jumps of 20% or more. Then check whether the spike lines up with a viral post, a media mention, or a collaboration. Go through 30–50 recent comments and look for signs of actual conversation and clear links to the post itself. Repetitive phrases, off-topic emojis, sudden comment bursts, or the same small set of accounts showing up on nearly every post all deserve a closer look.
If the audience seems genuine, one more question matters: can this creator help you get the result you want?
Campaign Fit
Review at least three recent sponsored posts. Look at message clarity, disclosure, audience sentiment, and whether paid posts perform differently from organic ones. Then line the creator up with your goal:
- Reels or TikToks for reach
- Tutorials or reviews for consideration
- Stories with tracked links for traffic
Put the details in writing: deliverables, usage rights, dates, tracking links, and disclosure terms.
| Criterion | Strong signal | Warning sign |
|---|---|---|
| Engagement quality | Steady Instagram performance; strong average views on TikTok; specific comments | Very low engagement or generic reactions |
| Audience fit | Audience match with the target customer profile; location and age align with the campaign | Audience is concentrated outside the target market |
| Authenticity | Gradual growth; low or explainable fake-follower levels; natural comments | Sudden follower spikes; clear fake-follower red flags; repetitive or bot-like comments |
| Campaign fit | Niche matches the product; creator can deliver the required format and reporting | Creator can't produce the needed format, disclose properly, or share analytics |
6. Macro Creators
At the macro level, reach can grow fast. The tradeoff is that audience fit gets harder to check with confidence. Macro creators are often grouped into the 100,000–1 million follower range, though some sources put the line at 500,000+.
That kind of scale works well for awareness campaigns, product launches, and seasonal pushes. But big numbers can blur the picture. A large audience may still be the wrong audience, and inflated metrics can hide in plain sight.
Engagement Quality
Look at median performance across 10–20 similar posts, not just one standout hit. Then calculate engagement in two ways: once by follower count, and again by actual reach or views when that data is available.
For Instagram macro creators, a healthy engagement rate often lands around 1%–2%. On TikTok, macro creators can hit 7%–8%, depending on the format and niche.
Averages alone can fool you. One viral post can make a profile look stronger than it is, so the median usually tells the cleaner story.
Audience Fit
Ask for 30–90 days of analytics and check whether audience age and location line up with the campaign. Don’t stop at the creator’s profile bio or public image. At this level, you need to confirm both who the audience is and where the content actually reached viewers.
That gap matters more than many teams expect. A U.S.-based lifestyle creator might look like a clean fit at first glance, but their follower base could lean heavily overseas, especially on TikTok, where discovery moves across borders with ease. In some cases, audience location and content reach can drift far apart.
Authenticity Signals
Macro accounts get hit hard by follower inflation, so small odd patterns matter more here. A healthy macro account usually shows about 1 comment per 20–50 likes. On Instagram, Story views should be around 3%–7% of total followers for an active audience.
One industry report estimated macro creator fraud at roughly 48%. That’s a big number, but don’t treat any fraud score like a final verdict. Use it as a filter, then check the account by hand before signing a contract.
Campaign Fit
Once the audience looks right, the next step is simple: does this scale match the goal?
Macro creators are a strong match for reach-first campaigns. But if the job is conversion, a smaller creator with a tighter audience may do better. Big reach sounds great on paper, yet it doesn’t always turn into action.
Get macro-specific terms into the contract early, especially:
- exclusivity
- whitelisting or Spark Ads permissions
- tracking requirements
| Criterion | Strong signal | Warning sign |
|---|---|---|
| Engagement quality | Consistent median across 10–20 posts; strong saves, shares, or watch time | Single viral post drives the average; views and interactions misaligned |
| Audience fit | Location and age verified against 30–90 days of analytics | Large follower count with out-of-market or misaligned demographics |
| Authenticity | ~1 comment per 20–50 likes; Story views at 3%–7% of followers | Fraud score above threshold; geographic clusters unrelated to niche |
| Campaign fit | Scale matches awareness goal; trackable links or codes confirmed | Tighter audience needed for conversions; rights or exclusivity unresolved |
Authenticity and Audience Fit: What to Check
Use these checks to compare Instagram and TikTok creators on the same scale. The goal is to spot patterns, not overreact to one odd metric. A small amount of fake followers is normal. But once that number goes above 25%, treat it as a red flag.
Start with follower growth shape. Organic growth usually looks a little messy: steady month to month, with the occasional spike after a viral post. What you don’t want to see is a sudden jump of 20% or more overnight. Another warning sign: gains that look too neat, like exactly 100 new followers every day for weeks, which often indicates unnatural growth services.
Next, check comment quality next to engagement rate. Raw like counts can look good on the surface, but comments tell you more. If you keep seeing the same generic replies - like "Nice!" or "🔥" - across post after post, that can point to engagement pods. A solid benchmark is 1 comment for every 20–50 likes.
Then comes audience fit, which is where a lot of teams miss the mark. A creator’s bio and content style may seem like a match, but their audience might lean toward the wrong age range or live in places that don’t match your market. Use native audience insights or top travel influencers databases to check location, age, and gender. If there’s little overlap between the audience location and the campaign target market, that should come up before the deal is signed, not after.
After that, line up those signals with your campaign goals and the creator’s tier.
Here’s a quick side-by-side checklist:
| Category | Verified Signals | Warning Signs | Follow-up Evidence Needed |
|---|---|---|---|
| Follower Growth | Steady 3–10% monthly increase; occasional viral spikes | Sudden 20%+ overnight jumps; round-number daily gains | 6-month growth charts from native creator tools |
| Engagement | 1 comment per 20–50 likes; niche-specific dialogue | Rate below 1%; generic or repetitive comments | Reach vs. impressions data for the last 10 posts |
| Audience Quality | Story views at 3–7% of total followers; complete follower profiles | Random-string usernames; no profile photos; no bios | Audience authenticity score; 30-day retention data |
| Audience Fit | Age and location align with brand's target market | Followers concentrated in off-market geographies | Direct screenshots of audience insights from the creator |
| Performance Consistency | Consistent engagement across carousels, Reels, and standard posts | Strong numbers on one viral outlier; flat performance elsewhere | Past brand collaboration results |
Pros and Cons by Creator Type
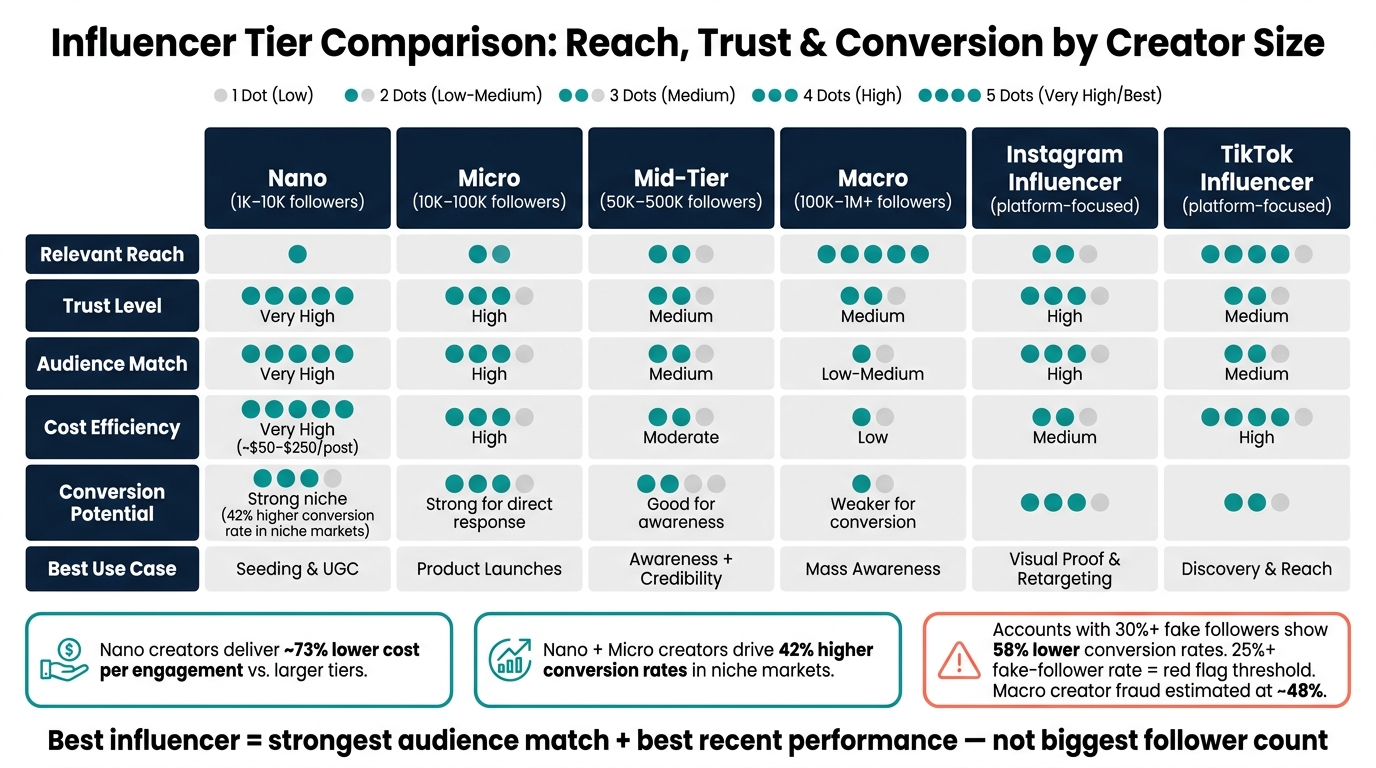
Influencer Tier Comparison: Reach, Trust & Conversion by Creator Size
No single creator type wins every campaign. The best pick depends on your goal, target audience, budget, and one simple thing people often skip: does the creator’s actual audience line up with the brief?
The table below compares creator types using the same audience-quality standards covered earlier.
| Creator Type | Relevant Reach | Trust | Consistency | Audience Match | Value | Conversion Potential |
|---|---|---|---|---|---|---|
| Instagram Influencer | Medium | High | Medium | High | Medium | Best for audience verification and visual proof |
| TikTok Influencer | High | Medium | Variable | Medium | High | Best for discovery; audience precision needs validation |
| Nano (1K–10K) | Low per creator; high per dollar | Very High | Variable | Very High | Very High – roughly $50–$250 per post | Strong in niche markets; nano and micro creators have been reported to drive 42% higher conversion rates in niche markets |
| Micro (10K–100K) | Medium | High | Medium-High | High | High | Strong for product launches, affiliate programs, and direct response |
| Mid-Tier (50K–500K) | High | Medium | High | Medium | Moderate | Good for awareness paired with category credibility |
| Macro (100K–1M+) | Very High | Medium | High | Low-Medium | Low | Best for awareness launches; weaker for efficient conversion |
Here’s the pattern: as creator size goes down, trust usually goes up. As size goes up, reach gets bigger, but audience precision often gets looser. That’s the tradeoff.
Smaller creators tend to bring tighter audience fit and stronger trust. Larger creators bring scale, but usually with less precision. If you care about cost efficiency, nano and micro creators often stand out. Nano creators, for example, can deliver roughly 73% lower cost per engagement than larger tiers. And in niche markets, nano and micro creators have been reported to drive 42% higher conversion rates.
Platform matters too. Instagram is usually easier to verify, which makes it easier to check audience quality and see visual proof. TikTok can drive much more discovery, but you’ll want closer checks on audience location and watch-time before moving ahead.
The practical move is simple: match the creator type to the campaign goal, then verify the fit with audience data.
Conclusion
Once you’ve checked engagement, audience fit, authenticity, and campaign fit, it’s time to make the final call on qualified reach. Pick the creator whose audience lines up best with your goal.
Use verified data from platform analytics or a verified media kit. Then compare each shortlisted creator with the same metrics over the same 30–90 day window. That keeps the comparison fair. If one creator is measured over 30 days and another over 90, the numbers can get muddy fast.
To estimate how many people a creator can realistically reach in your target market, use this formula: median reach × U.S. audience share × target-age share. That gives you a qualified reach estimate, which tells you far more than raw follower count ever will.
Here’s the side-by-side framework to use:
| Platform | Follower Count | Median Reach/Views | Engagement Rate | U.S. Target-Location Share | Target-Age Share | Authenticity Concerns | Content Fit | Campaign Role | Final Decision |
|---|---|---|---|---|---|---|---|---|---|
Stick to verified metrics only when comparing shortlisted creators.
Also, require clear FTC disclosure of any material connection, including payment or free products, using plain labels like Ad or Sponsored.
FAQs
How do I calculate qualified reach?
Start by finding an influencer’s audience size that actually matters: take the total follower count, then remove fake followers and bots. If an account has more than 30% fake followers, conversion rates are often much lower. That makes this audit the first thing to do, not an afterthought.
Next, estimate impact using benchmarks tied to authentic reach, not vanity metrics. Outfame’s analytics tools can help you audit audience quality and check demographics to see whether the audience lines up with your target market.
Which metrics matter most on Instagram vs. TikTok?
On Instagram, the metrics that matter most are saves, DM shares, and meaningful comments. Those actions show that people didn’t just scroll past your post - they found it useful, worth sharing, or worth talking about. That kind of deeper interest can help more people discover your content.
On TikTok, watch time and video completion rate carry the most weight. If people keep watching and finish the video, TikTok is more likely to push it on the For You Page.
There’s also a key difference in how engagement is measured on each platform. On Instagram, engagement is measured against your follower count. On TikTok, it’s measured against total video views.
What is a bad fake-follower rate?
Most legit accounts naturally have 5%–15% fake followers. Once that number goes above 20%, it’s a red flag. At 30%+, there’s a strong chance the account has bought followers or is dealing with bot activity.
When fake followers hit 40% or more, engagement is usually worthless, and the account is best avoided. There’s also a second problem: high fake-follower rates can hurt visibility. Platforms often calculate engagement based on total follower count, so a bloated audience can drag down reach.


