
If your Instagram account is getting views but not followers, the problem is usually in one of four places: reach, engagement, profile visits, or follows. I’d start by pulling a 7-day or 30-day baseline, then track accounts reached, profile visits, net follower gain, and link taps. From there, I’d fix the first weak step in the funnel instead of changing everything at once.
Here’s the short version:
- Use Instagram Insights on a Creator or Business account
- Track one date range at a time like 09/01/2026–09/30/2026
- Log core numbers: reach, engagement, profile visits, follows, unfollows, and taps
- Read the funnel: reach → engagement → profile visits → follows
- Test one change only: bio, pinned posts, hook, topic, or CTA
- Compare equal periods: 7 days vs. 7 days or 30 days vs. 30 days
A simple example: if you reached 40,000 accounts, got 1,200 profile visits, and only 18 follows, your visit rate is about 3%, but your follow rate from visits is just 1.5%. That usually means your content is getting attention, but your profile is not giving people a clear reason to follow.
What I like about this approach is that it keeps the process simple. Instead of guessing, I can look at the numbers, find the drop, make one change, and check whether that move led to more visits, follows, or taps in the next period.
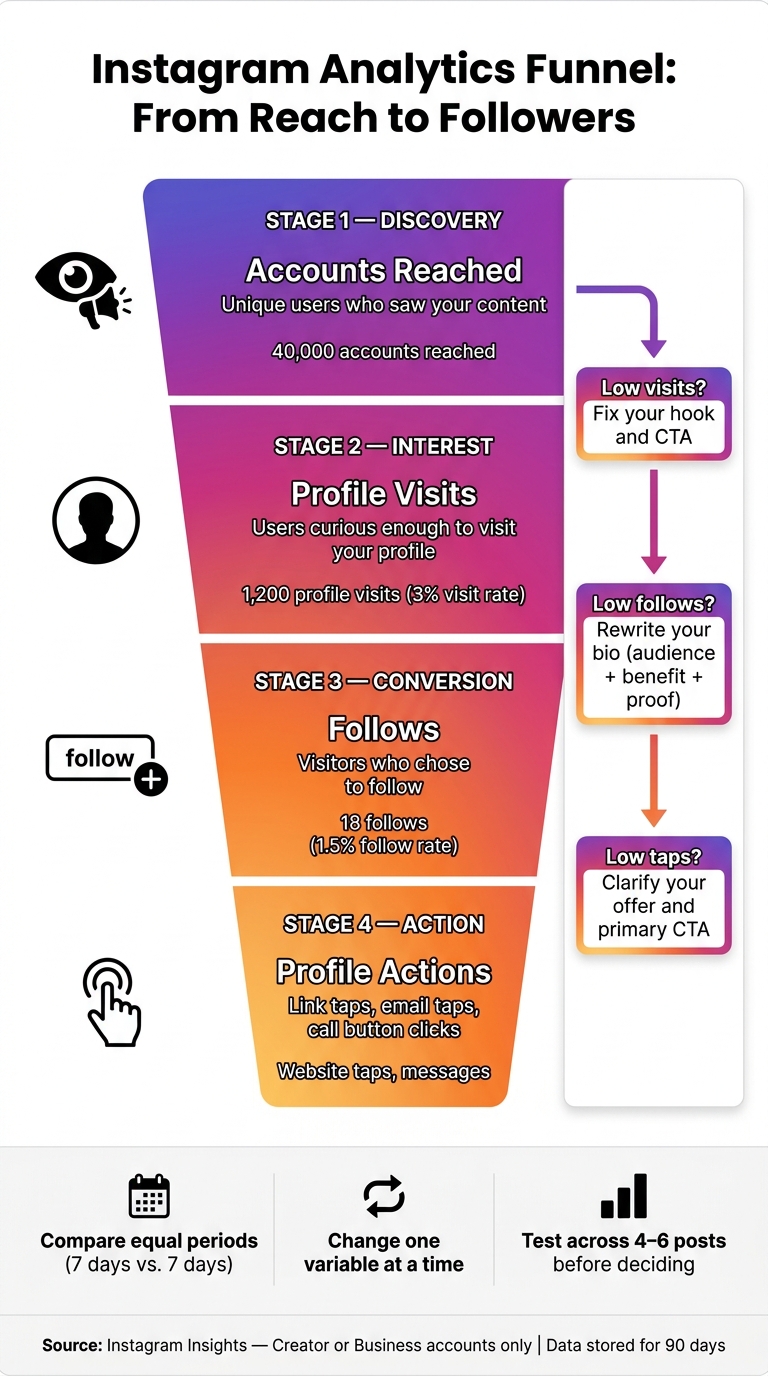
Instagram Analytics Funnel: From Reach to Followers
How to Use Instagram Analytics to Grow Faster
sbb-itb-3b12fba
How to Access Instagram Insights and Set a Baseline
Start by setting a baseline for the same date range you plan to compare later. In plain English, open Insights, choose a reporting window, and write down your numbers. That baseline gives you a clean before-and-after view, so you can see if changes to your bio, posts, or CTA lead to more discovery and more conversions.
How to Open Insights on a Professional Account
Instagram Insights is only available on Creator or Business accounts. So if you're using a personal profile, you won't see it. If the option is missing, switch your account type to Professional in your settings first.
Once your account is set up, open Insights in four steps:
- Open your profile.
- Tap "Professional dashboard" at the top of your profile, or use the menu icon (the three horizontal lines) in the top-right corner.
- Select "Insights."
- Choose your reporting window - for example, Last 7 Days or Last 30 Days.
Instagram Insights stores only 90 days of data, so keep your own weekly or monthly tracker if you want to spot longer-term trends.
Which Baseline Numbers to Record First
Once you're inside Insights, don't try to measure everything at once. That's the fastest way to get lost in the weeds. Instead, focus on the metrics tied to discovery, engagement, profile conversion, and follower action.
| Metric | What It Measures |
|---|---|
| Accounts Reached | Unique users who saw your content |
| Accounts Engaged | Users who engaged by liking, commenting, saving, or sharing |
| Profile Visits | How many people clicked through to your profile page |
| Net Follower Gain | New followers minus unfollows |
| Link/Button Taps | Clicks on your bio link or contact buttons (if available) |
These numbers become your before-and-after benchmark for each profile update. Log them in a weekly or monthly tracker, use U.S. date formatting like 09/24/2026, and compare equal windows: 7 days to 7 days or 30 days to 30 days.
From there, you can use the baseline to spot the weak point in your funnel: reach, engagement, profile visits, or follower growth.
The Metrics That Matter Most and How to Read Them
Once you have your baseline numbers, the next step is figuring out what each metric is actually telling you. The easiest way to diagnose profile growth is to read the sequence like a funnel:
reach → engagement → profile visits → follows or profile actions
How to Tell Whether the Problem Is Discovery or Conversion
You can think of your Instagram metrics as a four-stage funnel: discovery → interest → conversion → action. Each stage lines up with a metric. When one number is weak, it usually points to a specific problem and a specific fix.
Accounts reached shows how many unique people saw your content. That’s your discovery signal. Profile visits shows how many of those people cared enough to check out your account. That’s your interest signal. Follows shows how many visitors decided to stick around. That’s your conversion signal. And profile actions - website taps, email taps, call button taps - shows whether your profile is moving people toward the next step you want them to take.
Here’s a simple example. Let’s say you look at a 30-day window and see 40,000 accounts reached, 1,200 profile visits, and 18 follows. Your profile-visit rate is 3% - not bad. But your follow-conversion rate is only 1.5%. That gap usually means discovery is doing its job, but the profile itself isn’t giving people a strong reason to stay.
Use these ratios to compare your own periods, not someone else’s. What matters most is the drop from your normal pattern.
Focus on:
- Profile-visit rate
- Follow-conversion rate
- Action rate
Start with the ratio that fell the most versus your baseline. Then use those numbers to find the first weak point in the funnel.
Metric Interpretation Table: What Each Number Means and What to Change
| Metric | What it indicates | Recommended next action |
|---|---|---|
| Accounts reached | Unique accounts exposed to your content | Test stronger hooks, keywords, hashtags, and posting times |
| Views | Total plays, including repeats from the same account | Improve the opening seconds and overall pacing |
| Accounts engaged | Unique accounts that interacted with content | Make more useful, opinionated, relatable, or action-focused content |
| Saves | Future-use value in the viewer’s mind | Make tutorials, checklists, and step-by-step guides |
| Shares | Relevance to someone else | Ask: would someone send this to a friend? Make the idea more practical or identity-based |
| Profile visits | Interest strong enough to check the account | Add a profile-focused CTA; line up posts with your profile promise |
| Follows | Profile-level conversion | Rewrite the bio around audience, benefit, and niche |
| Net follower growth | New follows minus unfollows | Check whether the profile delivers what the content promised |
| Profile actions | Actions taken after visiting the profile | Pick the action that matters most - follow, website visit, email, or call - and make it stand out in the bio and calls to action |
That read gives you the next profile or content change to test.
How to Compare Posts, Reels, and Stories by Outcome
Compare each format against the job it’s supposed to do. A Reel and a carousel do different things, so judging them by one metric alone can send you in the wrong direction.
For Reels, start with reach and views to measure discovery. Then check profile visits and follows to see whether that exposure is turning into account growth.
For carousels and static posts, saves and shares matter more than likes. Those numbers tell you the post was useful enough to revisit or pass along.
For Stories, look at replies, link taps, and completion or exit patterns, when available. That gives you a better read on relationship-building and conversion.
Before you change anything, compare several posts in the same format. Then look for the strongest pattern and use it to decide the one profile or content change to test next.
How to Turn Analytics Into Profile and Content Updates
Once you know whether the bottleneck is reach, visits, or follows, make one targeted change based on that signal.
What to Change When Reach, Profile Visits, or Follows Are Low
Each weak metric usually points to a pretty clear fix.
If reach is high but profile visits are low, your hook is getting views, but it’s not making people curious enough to check your profile. Tighten the opening frame, connect it more clearly to what your profile promises, and test the hook, cover, and CTA one at a time.
If profile visits are high but follows are low, the content is doing its job, but the profile isn’t turning visitors into followers. Look at it like a first-time visitor would. Your name field should include searchable terms. Your profile image should be clear at thumbnail size. And your bio should quickly answer three things: who you help, what you offer, and why someone should follow. It also helps to pin an intro post, proof, and a common FAQ.
If profile visits are high but link or contact taps are low, the next step probably isn’t clear enough. For example, a local service business could swap a vague line like We provide quality services for Same-week residential plumbing in Phoenix - call for a free estimate. Put one main action in the bio, place it first, and check that the link, button, landing page, and business hours all match the offer.
How to Build a Simple Testing Cycle for Profile and Content Changes
Keep the process simple: baseline, change one variable, publish similar content, evaluate, decide.
Write down your current reach, profile visits, follows, profile-visit rate, and follow-conversion rate for the previous reporting period. Then choose one thing to test, such as your bio, name field, profile photo, pinned posts, topic, format, hook, or posting time.
Don’t judge a change from one post. If you’re testing a new hook, use it across four to six posts on a similar topic. Then, at the end of the next reporting period, compare the same metrics.
- Keep changes that improve the main metric without hurting secondary metrics
- Revise changes that produce mixed results
- Drop changes that do nothing
Change one variable at a time so you can see what caused the result.
The table below shows the most common bottlenecks and the fastest fix for each.
Pattern Table: Common Bottlenecks and What to Adjust
Use these patterns to move from diagnosis to the next test.
| Observed pattern | Probable bottleneck | Profile or content adjustment |
|---|---|---|
| High reach, low profile visits | Weak hook or unclear positioning | Make the opening benefit specific; add a profile-visit CTA in the caption or on-screen text |
| High profile visits, low follows | Confusing bio, weak name field, or poor pinned content | State audience + benefit + proof in the bio; add searchable name-field terms; pin an introduction, proof, and best next step |
| High saves, low follows | Valuable content, weak ongoing promise | Turn the topic into a recurring series; state the repeat benefit in the bio; pin a start-here post |
| High Reel views, low profile activity | Reach without a bridge to the account | Add on-screen context, a niche-specific CTA, and a pinned post that continues the topic |
| High profile visits, low call-button taps | Weak offer clarity | Put service area, availability, and the main action in the bio; pin proof, pricing, or next steps |
| High shares and saves, low follows | Content is valuable but account identity is not memorable | Use consistent visual branding, repeat the niche promise, and add a follow CTA tied to future content |
| Strong Stories replies, weak feed reach | Engaged existing audience but limited discovery | Repurpose recurring Story questions into searchable Reels or carousels with stronger opening frames |
How to Track Progress Over Time and Which Metrics to Watch
Growth comes from improving the funnel: reach → profile visits → follows → profile actions. Once you spot the bottleneck, keep tracking that same funnel on a fixed schedule.
Set a fixed reporting routine. Do a quick weekly check to catch unusual changes, then do a deeper 30-day review once a month. Use the same weekly and monthly date ranges every time. Look at percentage change, not just raw totals. And write down outside events, like collaborations, viral posts, holidays, or posting changes, so you don’t confuse a short spike with a real pattern.
A simple monthly scorecard can track:
- accounts reached
- profile visits
- profile-visit rate
- new follows
- follow-conversion rate
- one action metric, like website taps or messages
Add a short notes column for any profile or content changes you made during that period. For example, one row could read: May 1–28: 18,500 reach; 740 profile visits; 96 follows; 42 website taps; updated bio on May 15. That notes column helps you connect changes to results. It also makes each new test much easier to read in context.
If you want a second layer of monitoring between reviews, use a real-time growth tool. Outfame can add real-time growth monitoring and audience targeting between Instagram Insights reviews.
Key Points to Remember Before Making Your Next Change
Use equal date ranges, track the same metrics, and change one variable at a time.
FAQs
How often should I check Instagram Insights?
Use a simple review schedule:
- Spend 15 minutes each week checking reach and engagement.
- Spend 30 minutes each month reviewing growth trends and top content.
- Do a full audit every quarter.
For bio updates, set aside 20 minutes each month. Then do a deeper review every three months.
If you need real-time monitoring or tracking past Instagram’s 90-day limit, Outfame can help.
What follow-conversion rate is considered good?
There’s no single benchmark for follow-conversion rates. The best way to judge yours is to track profile visits against new followers.
If that rate is strong, your bio and content are doing their job. They’re giving people a good reason to stick around. If it’s lower than you want, tighten up your profile.
A few simple tweaks can help:
- Add a clear call to action to your bio
- Pin your top-performing posts so visitors can see your value right away
When someone lands on your profile, they should get the point fast. What do you post, who is it for, and why should they follow? Your bio and pinned posts should answer that in seconds.
Which profile changes should I test first?
If profile visits are high but follower growth stays low, your profile probably isn’t turning visitors into followers. In that case, start with your bio or grid layout.
Test one bio element at a time. That could be your opening line, your call to action, or your link destination. Then give it time - at least 30 days - before you judge the result. If your profile visit-to-follow conversion rate is under 10%, it may be time to refresh your top nine posts.


