Engagement rates on Instagram have dropped by 28% since 2024, with the platform-wide average now at 1.22%. In 2026, saves and shares are the most important metrics, surpassing likes in value. Content like Reels and carousels outperform static images, which have seen a 17% decline in engagement year-over-year. Here's a quick breakdown of what a "good" engagement rate looks like today:
-
General Benchmarks:
- 1–3%: Average
- 3–6%: Strong
- 6%+: Outstanding
-
By Follower Count:
- Nano (1K–10K followers): 5%+ is good
- Micro (10K–50K): 3.5%+ is good
- Macro (100K–500K): 1.8%+ is good
-
By Niche:
- Education: 3.8%
- Beauty: 1.7% (lower due to fake followers)
To calculate your engagement rate, use formulas like ERR (Engagements ÷ Reach × 100) for organic content or ER Post (Engagements ÷ Followers × 100) for comparisons. Tools like Outfame help refine these metrics and target the right audience for better results. Focus on meaningful interactions - like saves, shares, and comments - to stay relevant in Instagram's evolving algorithm.
Instagram Engagement Is Changing in 2026: Benchmarks Explained by Social Media Strategists
sbb-itb-3b12fba
How to Calculate Instagram Engagement Rate
Choosing the right formula depends on what you want to measure - whether it’s content quality, audience loyalty, or ad performance. Let’s break down the key methods and when to use them.
Core Engagement Rate Formulas
Here are some of the most common formulas:
| Formula | Calculation | Best For |
|---|---|---|
| ER by Reach (ERR) | (Engagements ÷ Reach) × 100 | Evaluating content quality |
| ER by Followers (ER Post) | (Engagements ÷ Followers) × 100 | Comparing posts or vetting influencers |
| ER by Impressions | (Engagements ÷ Impressions) × 100 | Measuring paid ad performance |
| ER by Views | (Engagements ÷ Video Views) × 100 | Measuring the impact of Reels |
Among these, ERR is often regarded as the most accurate for organic content in 2026. Since not all followers will see every post, ERR provides a clearer picture of how engaging your content is for those who actually come across it.
"ERR cuts through the noise of the algorithm. It tells you the percentage of people who saw your content and were inspired enough to actually interact." - PostSyncer
On the other hand, ER Post (based on followers) is handy for quick comparisons, especially when reach data isn't available. It’s a go-to for tracking your own posts over time or evaluating influencers.
Next, let’s explore how these formulas apply at both the post and account levels.
Post-Level vs. Account-Level Rates
A post-level rate focuses on how well a single piece of content performs. It’s useful for pinpointing which formats, topics, or calls-to-action resonate most with your audience.
In contrast, an account-level rate gives you a broader view of overall performance. To calculate this, average the engagement rates from your last 10 to 30 posts. This metric is commonly used by brands and agencies to assess account health or for media kits.
For a daily snapshot, there’s also the Daily Engagement Rate, calculated as (Total Engagements in a day ÷ Followers) × 100. This metric helps gauge audience loyalty on a day-to-day basis.
Data Inputs You Need for Calculations
To ensure accurate calculations, you’ll need precise data from Instagram Insights. Collect metrics like likes, comments, shares, saves, reach, impressions, and video views. Keep in mind that Instagram Insights is only available for Business and Creator accounts, so if you’re still using a personal profile, switching account types is your first step.
You can access post-specific data through the "View Insights" button below each post and account-wide metrics via the "Insights" tab on your profile. As of 2026, saves and shares are particularly important, as they carry significant weight in Instagram’s algorithm. Be sure to include these in your engagement totals.
What Is a Good Instagram Engagement Rate in 2026?
Instagram Engagement Rate Benchmarks by Follower Tier & Niche (2026)
Once you’ve figured out how to calculate engagement, the next step is understanding what qualifies as a "good" engagement rate. This depends on factors like account size, niche, and the type of content you post.
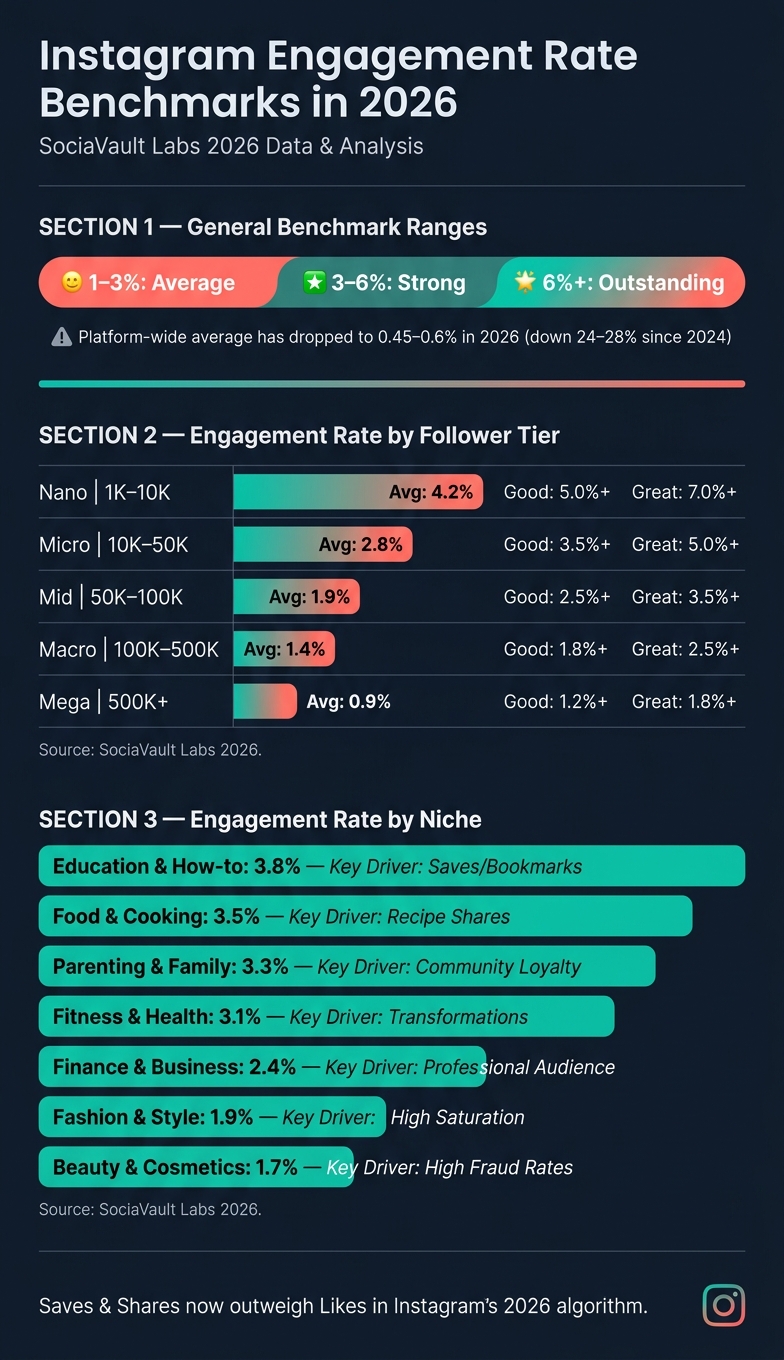
General Benchmark Ranges
In 2026, engagement rates can be grouped into three categories: 1–3% is average, 3–6% is strong, and anything above 6% is outstanding. However, the platform-wide average has dropped significantly to about 0.45–0.6%, reflecting a 24–28% decline compared to 2024 levels. This shift highlights the growing importance of engagement metrics like saves and shares.
Chloe Maguire, Brand & Social Media Lead at Leapsome, captures this change perfectly:
"Engagement hasn't disappeared, it's evolved. We're seeing a shift from passive engagement (likes) toward private engagement (shares, saves, DMs) and community-based interaction."
Metrics like saves and shares now carry more weight than likes. For example, an account with a lower engagement rate but high save rates might actually be performing better than one with more likes but fewer meaningful interactions.
Benchmarks by Follower Count
Follower count plays a big role in setting realistic engagement expectations. Smaller accounts tend to have higher engagement rates because of their closer connection with followers. As accounts grow, this intimacy often decreases, and Instagram’s algorithm only reaches a fraction of the audience.
Here’s how engagement rates stack up by follower tier in 2026:
| Follower Tier | Follower Range | Average ER | "Good" ER | "Great" ER |
|---|---|---|---|---|
| Nano | 1K – 10K | 4.2% | 5.0%+ | 7.0%+ |
| Micro | 10K – 50K | 2.8% | 3.5%+ | 5.0%+ |
| Mid | 50K – 100K | 1.9% | 2.5%+ | 3.5%+ |
| Macro | 100K – 500K | 1.4% | 1.8%+ | 2.5%+ |
| Mega | 500K+ | 0.9% | 1.2%+ | 1.8%+ |
(Source: SociaVault Labs 2026)
For accurate benchmarking, compare your engagement rate with others in your follower tier. For example, a Nano creator achieving 6% and a Mega creator hitting 1% can both be performing exceptionally well for their respective sizes.
Benchmarks by Niche and Content Format
Engagement success also varies depending on your niche and the type of content you create. For instance, the Education & How-to niche leads with an average engagement rate of 3.8%, driven by saves as users bookmark instructional posts. On the other hand, the Beauty & Cosmetics niche averages just 1.7%, partly due to a fake follower rate of 52.1%, which dilutes genuine engagement.
| Niche | Avg. ER | Key Driver |
|---|---|---|
| Education & How-to | 3.8% | Saves/Bookmarks |
| Food & Cooking | 3.5% | Recipe Shares |
| Parenting & Family | 3.3% | Community Loyalty |
| Fitness & Health | 3.1% | Transformations |
| Finance & Business | 2.4% | Professional Audience |
| Fashion & Style | 1.9% | High Saturation |
| Beauty & Cosmetics | 1.7% | High Fraud Rates |
(Source: SociaVault Labs 2026)
Content format is another crucial factor. Carousels lead the pack with an average engagement rate of 3.1%. Instagram often resurfaces carousels by showing a different slide if users initially scroll past them, giving posts a second chance to grab attention. Reels average 2.4% and remain a favorite for discovery, with a 33% year-over-year increase in posting. Meanwhile, static images trail behind at about 1.8%.
How to Use Engagement Rate Calculators Effectively
Types of Engagement Rate Calculators
Engagement rate calculators come in different forms. Some basic tools only account for likes and comments, which doesn't provide the full picture in 2026. More advanced options include saves and shares as weighted factors, offering a clearer view of how your content aligns with Instagram's algorithm.
When selecting a calculator, prioritize tools with flexible formulas. At a minimum, you’ll need access to two key metrics: Engagement Rate by Followers (ERF), ideal for competitor analysis and evaluating influencers, and Engagement Rate by Reach (ERR), which uses Instagram Insights data to measure performance among users who actually viewed your content. A third metric, Engagement Rate by Views (ERV), is tailored for Reels and should be applied separately from feed post metrics.
| Formula | Calculation | Best Use Case |
|---|---|---|
| By Followers (ERF) | (Interactions ÷ Followers) × 100 | Competitor analysis, influencer vetting |
| By Reach (ERR) | (Interactions ÷ Reach) × 100 | Internal content strategy |
| By Views (ERV) | (Interactions ÷ Views) × 100 | Reels and video performance |
Another essential feature to look for is format-specific analysis. For instance, Reels tend to deliver 67% more engagement than static image posts. Combining all content types into a single calculation can distort your results, so separating them is key. Next, let’s look at common mistakes that can throw off your calculations.
Common Mistakes to Avoid
To get accurate results, steer clear of these common errors. First, using too few posts - like 3 or 4 - can lead to skewed averages. A single viral post might inflate your numbers unrealistically. Analyze at least 12 to 30 recent posts to balance out anomalies and establish a true baseline.
Another misstep is relying on outdated follower counts. Always use your most current follower data when running calculations to avoid errors.
Fake and inactive followers are another hidden issue. With approximately 37.2% of influencer followers being fake, a high follower count combined with poor engagement often points to bots rather than audience disinterest. Running a fake follower audit ensures your data reflects real audience behavior. Lastly, don’t compare your engagement rate to accounts in vastly different follower tiers. For example, a 2% engagement rate is solid for accounts with over 100,000 followers, but it would be considered below average for accounts with fewer than 10,000 followers.
Getting More From Your Data With Outfame
Outfame offers a free engagement rate calculator paired with an AI-driven fake follower checker to tackle two of the biggest challenges in accuracy. The fake follower tool ensures your data reflects genuine audience behavior, giving you cleaner metrics.
Outfame goes beyond basic calculations. It allows you to compare your engagement against 2 million analyzed profiles and provides real-time follower updates to monitor sudden spikes or drops. For example, an influx of low-quality followers - even from a viral moment - can gradually lower your engagement rate. Outfame also factors in saves and shares as weighted signals, mirroring Instagram’s algorithm in 2026. By using advanced tools like Outfame, you can fine-tune your metrics and make smarter decisions to boost engagement. Weekly reviews help you spot changes in the algorithm or signs of content fatigue early, while monthly reports guide broader strategy adjustments.
How to Improve Instagram Engagement in 2026
Optimizing Your Content for More Engagement
Choosing the right content format is key. Reels and Carousels tend to outperform static posts by boosting discovery and encouraging saves. To maximize engagement, use Reels for visibility, Carousels for detailed or multi-step content, and single images for quick updates or announcements.
Your caption's opening line also plays a huge role. Those first 125 characters decide whether someone taps "more" or keeps scrolling. Questions like, "Which color screams summer to you?" are far more engaging than generic calls-to-action like, "Check the link in bio!" For instance, a fashion creator with 75,000 followers saw her engagement rate jump from 2% to 5.8% in just six months by shifting 60% of her content strategy to Reels and using direct questions in captions. And don’t forget Stories! Stickers like Polls, Quizzes, and Q&As are easy ways to encourage interaction.
Once your content strategy is in place, the next step is building the right audience.
Building a Higher-Quality Audience
Having the right followers is more important than simply having a large number. A big follower count with low engagement can hurt your performance - Instagram’s algorithm may interpret low interaction as a sign your content isn’t worth showing widely. Worse, fake followers can tank your engagement rate. For example, if an account with 1,000 real followers adds 9,000 fake ones, a 10% engagement rate could plummet to just 1%.
"An intimate, responsive community is far more valuable than a massive, silent one. The goal is no longer just to be seen, but to be felt and heard." - PostSyncer
To attract followers who genuinely care about your niche, try a layered hashtag strategy. Combine broad tags (1M+ posts), niche tags (50K–500K posts), and hyper-niche tags (under 10K posts) to increase your chances of reaching the right people. Tools like Outfame’s AI-powered audience targeting can take this further by focusing on followers who are statistically more likely to engage, helping you grow without sacrificing your engagement rate.
Testing and Tracking What Works
Once your content and audience strategies are fine-tuned, testing becomes essential. Regularly experiment with different formats to see what resonates most. Since Reels, Carousels, and Stories perform differently, analyze each type separately. For instance, if your Reels maintain a 5%+ engagement rate while single images hover around 1.5%, it’s clear where you should focus.
Play around with caption lengths, posting times, and hooks to figure out what drives the most interaction. If engagement suddenly dips, compare metrics like posting time or caption style to identify the cause. These insights should guide your content and audience strategies, ensuring a data-driven approach to growth. Outfame’s analytics dashboards can simplify this process by tracking trends over time and highlighting consistently high-performing content.
Conclusion: Key Takeaways for 2026
Success on Instagram in 2026 can't be pinned down to a single metric. Engagement rates vary widely, with smaller, niche-focused accounts often outperforming larger ones in terms of interaction. This highlights why traditional metrics fall short of capturing the full story.
Public likes are no longer the star of the show. Instead, saves and shares have taken center stage, signaling a shift toward private and more meaningful engagement.
"Engagement rate benchmarks change by follower size, content niche, content type, and year. What was good in 2023 is not what's good in 2026." - SociaVault Team
This shift in benchmarks isn’t just about measurement - it’s reshaping creative strategies too. Reels continue to drive discovery, Carousels encourage deeper interaction, and concise captions paired with a well-targeted audience amplify results. Regularly auditing your followers to remove fake or inactive accounts is still a must, as these accounts can quietly lower your engagement rate.
Tools like Outfame's AI-powered analytics and audience targeting make it easier to adapt to this ever-changing landscape. Their plans start at $39/month, with a free trial available. With the average engagement rate hovering between 0.45% and 0.6%, having precise data and flexible strategies is critical for turning these nuanced metrics into lasting growth.
FAQs
Should I use reach or followers to calculate engagement?
Engagement should be calculated using reach instead of follower count. Why? Because reach represents the number of people who actually see your content, making it a more accurate metric for measuring interactions. With Instagram's algorithm changes in 2024–2025, follower counts have become less relevant, as not all followers see every post. By focusing on engagement relative to reach, you get a clearer understanding of how well your content performs with the audience that actually views it.
What counts as an engagement in 2026 (likes vs. saves and shares)?
In 2026, engagement goes beyond just likes and comments. It now includes saves and shares, which are just as important. Why? Because saves and shares indicate a deeper appreciation for the content and help extend its reach to a wider audience.
These four types of engagement - likes, comments, saves, and shares - are all weighted equally. This approach ensures a fair measurement of content performance, reflecting the diverse ways users interact with and value content.
How many posts should I analyze to get an accurate engagement rate?
To get an accurate engagement rate, you should analyze at least 30 posts. This sample size provides a dependable average by reflecting recent activity and trends effectively.


