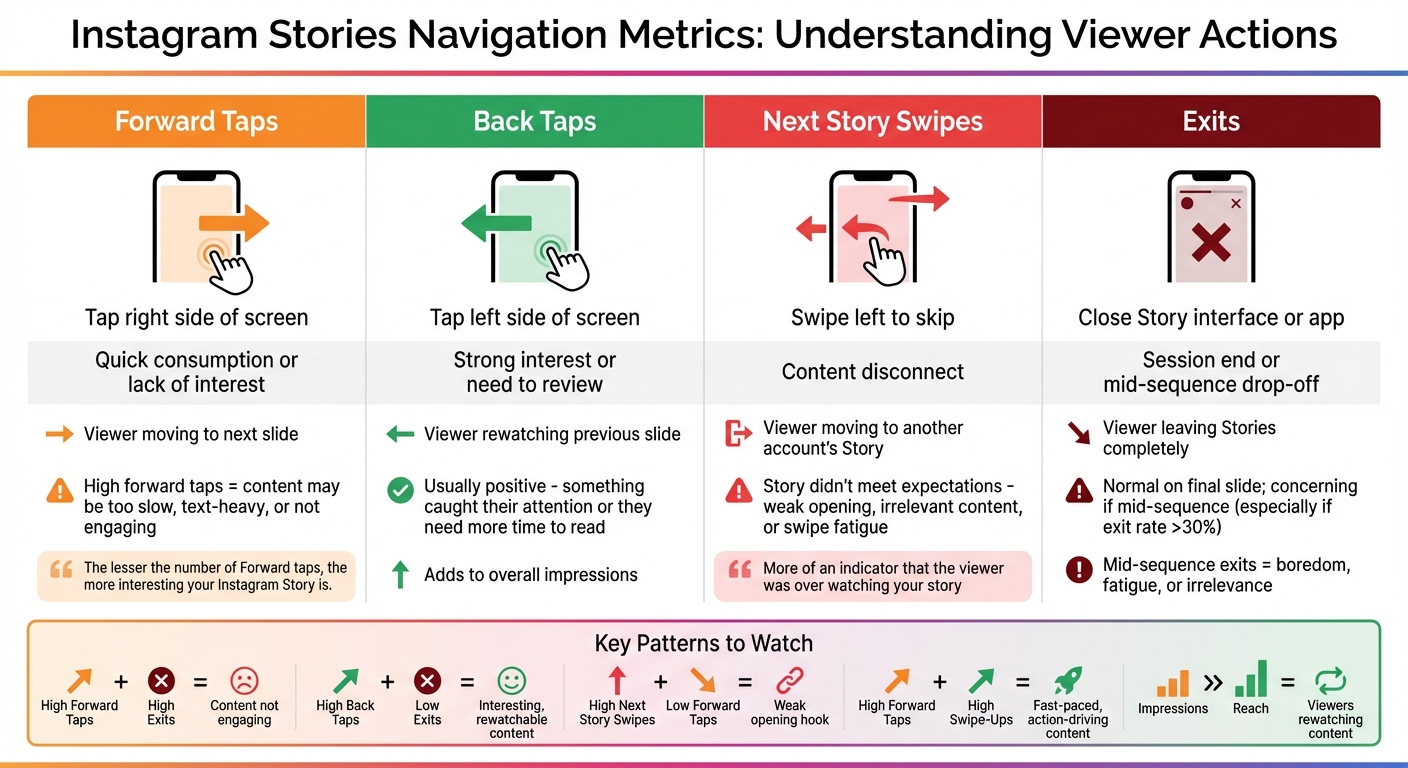
Navigation metrics in Instagram Insights track how viewers interact with your Stories. These actions include:
- Back Taps: Rewatching the previous slide.
- Forward Taps: Skipping to the next slide.
- Next Story Swipes: Moving to another account’s Story.
- Exits: Leaving the Stories interface entirely.
These metrics reveal how engaging your content is, where viewers lose interest, and what holds their attention. For example, high exits might mean your Story isn’t resonating, while frequent back taps suggest certain slides are worth revisiting.
To view these metrics, you need a Business or Creator account. Simply go to Insights > Content You Shared > Stories, and swipe up on a specific Story.
Key takeaway: Use navigation data to refine your Stories. High forward taps? Simplify your content. High exits? Shorten your sequence or improve your opening frame. Tracking these patterns over time can help improve engagement.
Instagram Stories Navigation Metrics Guide: What Each Action Means
What Does Navigation Mean on Instagram? - Everyday-Networking
Understanding Navigation Metrics in Stories
Each navigation metric sheds light on how viewers interact with your Stories. Whether they tap, swipe, or exit, these actions provide valuable clues about their experience and engagement.
Forward Taps
Forward taps happen when someone taps the right side of the screen to move to the next slide. It's the most frequent navigation action, as this mirrors how most people naturally browse through Stories. However, if you notice a high number of forward taps, it could mean your content isn't holding attention - maybe it's too slow, too text-heavy, or not engaging enough.
The challenge is figuring out whether viewers are tapping forward because they're eager to see what's next or because they're bored.
"The lesser the number of Forward taps, the more interesting your Instagram Story is." – Harshita Agrawal, Founder of eSocMedia
This metric is a great way to spot pacing issues that might need tweaking.
Back Taps
Back taps occur when viewers tap the left side of the screen to revisit a previous slide. This is usually a good sign - it means something on that slide caught their attention, whether it was a striking image or information they wanted to revisit.
Sometimes, though, back taps happen because text flashed by too quickly or wasn't clear enough. These rewatches also add to your overall impressions. On the flip side, you'll want to keep an eye on metrics that show when viewers completely lose interest, like Next Story Swipes.
Next Story Swipes
A next story swipe happens when someone swipes left to skip the rest of your Story and move on to another account's content. Unlike a forward tap, which shows ongoing engagement, this action signals that your Story didn't meet their expectations.
"Next story is more of an indicator that the viewer was over watching your story and wanted to skip to the next one." – Lexie Carbone, Content Marketing Specialist, Later
Common reasons for next story swipes include weak opening slides, content that feels irrelevant, or even swipe fatigue from too many consecutive slides. Tracking when these swipes occur can help pinpoint where you're losing your audience.
Exits
Exits are logged when a viewer closes the Story interface or the app entirely. The context of these exits matters. If someone exits on the final slide, it likely means they've finished watching. But if exits spike in the middle of your sequence - especially early on - it could mean your content isn't connecting with them.
Mid-sequence exits are often a sign of boredom, content fatigue, or irrelevance, though they can sometimes just reflect real-life distractions.
| Metric | Action | Viewer Signal |
|---|---|---|
| Forward Taps | Tap right side | Quick consumption or lack of interest |
| Back Taps | Tap left side | Strong interest or need to review |
| Next Story Swipes | Swipe left | Content disconnect |
| Exits | Close Story interface | Session end or mid-sequence drop-off |
How to Analyze Story Performance with Navigation Metrics
Reading Patterns in Navigation Metrics
Navigation metrics can provide a deeper understanding of how your content is performing. For instance, if you notice high forward taps combined with high exits, it likely means viewers are rushing through your slides and leaving - an indication that the content may not be engaging enough. On the other hand, high back taps with low exits suggest your audience finds the content interesting enough to revisit.
Another scenario to watch for is high next story swipes alongside low forward taps - this often points to a weak opening hook that fails to grab attention, prompting viewers to skip to another story. Meanwhile, high forward taps paired with high swipe-ups could indicate a fast-paced story structure that effectively drives quick actions. Lastly, if your impressions significantly outnumber your reach, it’s a strong clue that viewers are rewatching your content. Cross-referencing this with back taps can help you pinpoint the specific slide that’s capturing repeated attention. These insights allow you to track trends and refine your approach over time.
Tracking Data Over Time to Spot Trends
By reviewing navigation data over a period of 7–30 days using the Insights tab (MM/DD/YYYY), you can uncover meaningful patterns. For example, you might find that behind-the-scenes content generates more back taps than product-focused slides, or that Stories posted on Tuesday mornings tend to have fewer exits compared to weekend posts. Comparing Stories with similar reach can also highlight which content resonates most. Often, the slide with the fewest forward taps is the one that successfully held your audience’s attention. Keeping an eye on these trends will also help you identify potential red flags in your Stories' performance.
Warning Signs in Navigation Metrics
Certain metrics can act as warning signals for underperforming content. For instance, a sudden spike in next story swipes at a specific frame suggests an issue with that part of the story. Similarly, an exit rate exceeding 30% mid-sequence indicates a disconnect with your audience’s expectations. While exits on the final frame are normal, mid-sequence exits warrant closer inspection.
If you notice exits spiking before a call-to-action (CTA), consider moving the CTA to an earlier point in the sequence. Always contextualize these metrics by comparing them to your overall reach and impressions. For example, a high exit rate on content that reached 10,000 viewers tells a very different story than the same rate on content seen by just 500 people. These comparisons provide a clearer picture of what’s working - and what’s not - so you can make informed adjustments.
sbb-itb-3b12fba
How to Improve Stories Using Navigation Data
Leverage navigation data to fine-tune your Story's structure and keep viewers engaged from start to finish.
Creating Better First-Frame Hooks
The first three seconds of your Story are make-or-break. If your navigation metrics show early exits or next-story swipes, it’s time to rework your opening frame. Start with something that grabs attention instantly, like jumping into mid-action. People decide whether to stick around in just 1.7 seconds.
Try using pattern interrupts - unexpected visuals, bold statements, or curiosity-driven headlines - to stop viewers from swiping away. Skip vague phrases like "story time" and opt for specific hooks such as, "The 3 biggest mistakes we made (and what we learned)". Replace generic text with teaser headlines that tell viewers exactly what to expect. With watch time still being Instagram’s top ranking factor in 2026, those first few seconds are more important than ever.
Optimizing Text and Frame Timing
If your navigation data shows high forward taps, it could mean your content is dragging or overloaded with text. Viewers often tap forward when there’s too much to read in too little time. Simplify your slides by cutting down text and relying more on visuals or voice-overs.
On the other hand, high back taps paired with low exit rates suggest viewers are engaged but need more time to absorb your content. If a particular slide gets a lot of back taps, consider shortening the text or extending the frame duration so it’s easier to follow. Keep each video segment or frame under 7 seconds to maintain a quick, engaging pace. And don’t forget captions - many people watch Stories with the sound off.
Next, focus on refining your Story sequence to keep viewers from dropping off mid-way.
Shortening or Reorganizing Story Sequences
Long Story sequences can exhaust viewers, leading to swipe fatigue and early exits. If your navigation data shows a spike in exits mid-story, that’s a sign your audience is losing interest. Use next-story swipe data to pinpoint the exact slide where engagement drops.
To keep viewers hooked, break long sequences into shorter, more focused segments. Research suggests that the sweet spot for Story length is between 6 and 13 slides. If you notice viewers dropping off before your final slide, move your call-to-action earlier in the sequence. Mix up your content formats - static images, videos, Boomerangs, or interactive stickers like polls and quizzes - to keep things fresh. Posting your Stories throughout the day can also help you stay visible at the front of your followers’ Story bar.
Using Outfame Analytics with Navigation Insights
Instagram Insights only holds onto data for 90 days, which makes tracking long-term trends a challenge. That’s where Outfame steps in, offering a more comprehensive look at your Instagram performance. Instead of losing valuable historical data after three months, Outfame allows you to track navigation patterns and tie them to key outcomes like follower growth and engagement surges. This broader view connects short-term performance with your long-term growth strategy.
Tracking Navigation Trends Over Time
Outfame’s dashboards give you the tools to monitor navigation metrics - such as forward taps, back taps, exits, and next-story swipes - over extended periods. By analyzing this data across weeks or months, you can pinpoint which Story formats keep your audience engaged and which ones lead to drop-offs. Unlike focusing solely on surface-level metrics like reach or impressions, Outfame prioritizes behavioral data that offers deeper insights into what drives growth.
AI-Powered Content Suggestions
Outfame doesn’t just stop at identifying trends - it takes things further by using AI to refine your content strategy. By analyzing audience navigation behaviors, it highlights areas for improvement, like suggesting changes when exit rates exceed 30%. It can even create a 30-day content calendar, complete with tailored captions, visuals, and strategies designed to resonate with your audience.
Real-Time Data for Immediate Action
Outfame also delivers live analytics, giving you the ability to respond quickly to performance changes. If a Story shows high exit rates or excessive next-story swipes early on, you can adjust your approach for upcoming posts right away. This real-time feedback loop ensures you’re always equipped to make smarter, faster decisions and keep your content strategy on track.
Conclusion
Navigation metrics offer a window into your audience's behavior, showing what captures their attention and what might cause them to lose interest. While metrics like reach and impressions tell you how many people notice your posts, actions such as back taps, forward taps, next story swipes, and exits reveal how viewers engage with your content. By interpreting these signals, you can shift from guesswork to a well-informed, data-driven Instagram strategy.
For example, back taps suggest that viewers find your content worth revisiting. On the other hand, forward taps might signal that your pace is too slow or your message needs simplification. Next story swipes often indicate a loss of interest. Exits, while sometimes natural, could point to issues if they occur early or if your exit rate exceeds 30%. In such cases, it’s worth revisiting your hook or adjusting the length of your content. These metrics provide a foundation for regular analysis and strategic tweaks.
Make it a habit to review your navigation data weekly. Look for patterns to identify what resonates with your audience. Aim to grab attention in the first three seconds, include interactive elements to maintain engagement, and tailor your content to fit what your audience responds to best.
To take this a step further, tools like Outfame extend Instagram's 90-day data tracking limit and offer AI-driven recommendations when your engagement metrics shift. With over 500 million people using Instagram Stories daily, leveraging navigation metrics and advanced tools like Outfame can help you build a loyal and engaged audience as you move into 2026.
FAQs
How can I use Instagram Insights' navigation metrics to improve my Stories?
Instagram Insights' navigation metrics give you a clear picture of how viewers interact with your Stories. These actions include:
- Back taps: When viewers go back to rewatch a Story, it often signals strong interest or relevance.
- Forward taps or next-story swipes: These may indicate that the content didn't hold attention - perhaps it was confusing or uninteresting.
- Exit taps: This suggests the viewer lost interest entirely, finding the Story no longer relevant.
To make your Stories more effective:
- Focus on expanding or recreating content that triggers back taps, as it clearly resonates with your audience.
- Revisit slides with high forward or exit taps. Try to make them more engaging, concise, or include a compelling call-to-action.
Using these insights, you can fine-tune your Stories to capture attention, reduce drop-offs, and encourage viewers to stay engaged until the very end.
What does it mean if my Instagram Story has a high number of exits?
A high exit rate on your Instagram Story suggests viewers are leaving before watching it all the way through. This might mean your content isn’t holding their attention or doesn’t resonate with them.
To address this, take a closer look at your Story's pacing, visuals, and overall message. Aim to capture attention right away and deliver something worthwhile to your audience. Try mixing things up with interactive elements like polls or question stickers to spark engagement and keep viewers interested.
Why are back taps on Instagram Stories considered a good sign?
When viewers tap back to rewatch your Story, it’s a clear sign they find your content interesting or worth revisiting. This type of interaction is a strong engagement signal, highlighting what truly grabs their attention. Take note of these moments - they can guide you in crafting future content that keeps your audience coming back for more.


