TikTok engagement rates in 2026 are a key metric for creators and brands. Here's what you need to know:
-
What is Engagement Rate (ER)?
ER measures how actively your audience interacts with your content. It's calculated using two main formulas:- Follower-based: Total interactions ÷ Followers × 100
- View-based: Total interactions ÷ Views × 100
-
Why it Matters:
High engagement rates mean better performance on TikTok’s algorithm, which prioritizes shares, saves, and watch time over likes. This is crucial for creators seeking sponsorships or brands evaluating content effectiveness. -
Benchmarks in 2026:
- Median ER: 4.25%
- Smaller accounts (Nano, Micro) generally have higher ERs than larger ones (Macro, Mega).
- Niche matters: Entertainment content leads with a 6.92% median ER, while Fashion averages 3.21%.
-
Improving ER:
- Focus on strong hooks in the first 2–3 seconds.
- Post consistently (4+ times per week).
- Encourage shares and saves, as these weigh heavily in TikTok’s algorithm.
- Engage with your audience by responding to comments quickly.
If you're tracking performance, tools like Outfame offer real-time analytics and AI-driven recommendations to refine your strategy, starting at $39/month.
How to Reach an 18.2% Engagement Rate on TikTok | Pro Growth Strategy 2026
sbb-itb-3b12fba
How TikTok Engagement Rates Are Calculated
Now that we've covered how engagement is measured, let's break down how it's calculated.
The Two Main Engagement Rate Formulas
There are two primary ways to calculate engagement on TikTok, each offering a unique perspective. The follower-based formula calculates engagement by dividing total interactions (likes, comments, shares, and saves) by the number of followers, then multiplying by 100. On the other hand, the view-based formula uses the same total interactions but divides them by total video views instead. These formulas serve different purposes.
| Formula | Calculation | What It Measures |
|---|---|---|
| By Followers | (Likes + Comments + Shares + Saves) ÷ Followers × 100 | Audience loyalty and community engagement |
| By Views | (Likes + Comments + Shares + Saves) ÷ Views × 100 | Content performance and reach on the For You Page |
For TikTok, the view-based formula often provides better insights. Since the platform's For You Page frequently shares content with users who don't follow you, your video views can far exceed your follower count. Relying solely on the follower-based formula might make a high-performing video seem less impressive than it actually is.
"The view-based calculation is more common on TikTok because the algorithm shows content to non-followers, making views a more accurate measure of actual audience reached." - PostPlanify
Variations in Calculation Methods
While the two core formulas are widely used, some tools and platforms include additional metrics to refine the analysis. Saves, for instance, have become a standard metric as of 2026, thanks to TikTok's algorithm recognizing them as a strong indicator of valuable content. Advanced analytics tools may also factor in profile visits or follows from a video, though these aren't universally adopted in public formulas.
It's important to note that calculating engagement from a single video can lead to misleading results. Instead, averaging the engagement rates of your last 20–30 videos provides a more reliable and actionable figure. This method smooths out any anomalies and offers a clearer picture of overall performance.
Choosing the Right Formula for Your Goals
The formula you choose should align with your specific goals. If you're a brand evaluating potential creators for partnerships, the follower-based formula is ideal because it reflects how effectively a creator engages their existing audience. On the other hand, if you're a creator or marketer analyzing which types of content resonate most, the view-based formula is more practical. It measures how engaging your content is for everyone who sees it, not just your followers.
For comprehensive campaign reporting, it's often best to include both metrics: view-based engagement to assess creative performance and follower-based engagement to measure community impact.
What Is a 'Good' TikTok Engagement Rate in 2026?
TikTok Engagement Rate Benchmarks by Follower Tier (2026)
Now that you know how to calculate engagement rates, the next question is: what should you aim for? The answer depends on factors like your follower count, niche, and how you're measuring engagement. Below are some benchmarks to help you set realistic goals, broken down by follower tiers and views.
Benchmarks by Follower Tier
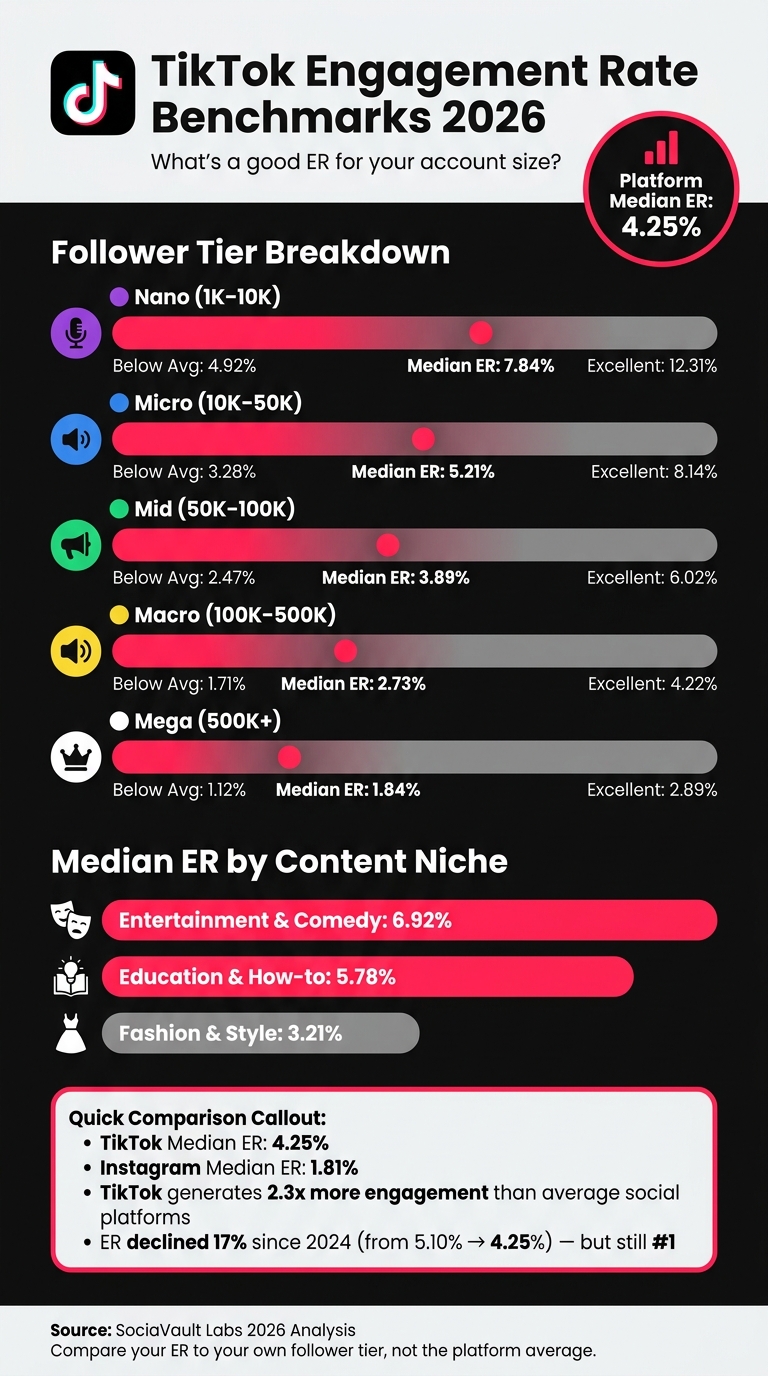
The platform-wide median engagement rate in 2026 is 4.25%. However, smaller accounts tend to have higher engagement percentages compared to larger ones. Here's a breakdown:
| Follower Tier | Median ER | Below Average (25th %) | Excellent (75th %) |
|---|---|---|---|
| Nano (1K–10K) | 7.84% | 4.92% | 12.31% |
| Micro (10K–50K) | 5.21% | 3.28% | 8.14% |
| Mid (50K–100K) | 3.89% | 2.47% | 6.02% |
| Macro (100K–500K) | 2.73% | 1.71% | 4.22% |
| Mega (500K+) | 1.84% | 1.12% | 2.89% |
Source: SociaVault Labs 2026 Analysis
This trend makes sense - larger accounts have a harder time maintaining proportional engagement as their audience grows. For instance, a mega-creator with a 2.50% engagement rate is actually doing well for their tier. Always compare your performance to others in your follower range, not the platform's overall average.
Benchmarks by Views and Platform Averages
In Q1 2026, the average TikTok engagement rate based on views is 4.20%. This metric is especially helpful for creators whose content frequently reaches non-followers through the For You Page.
TikTok continues to outshine other platforms in engagement. Its median engagement rate of 4.25% far exceeds Instagram's 1.81% and other major social networks. Even as TikTok's rates evolve, they remain the highest in the industry.
Factors That Shape What Counts as 'Good'
Context matters as much as the numbers. Your niche heavily influences what a strong engagement rate looks like. For example:
- Entertainment and Comedy content leads with a 6.92% median ER.
- Education and How-to content follows at 5.78%.
- Fashion and Style sits lower at 3.21%.
Content that encourages sharing - like tutorials, humor, or relatable moments - tends to drive more interactions. On the other hand, content meant for saving, such as outfit inspiration, usually sees fewer engagements.
"TikTok's algorithm is just genuinely better at closing the gap between people and content they actually care about. It doesn't feel like discovery, it feels like the platform already knows you." - Chris Sheen, Director of Social, Celonis
Posting frequency also plays a role. Accounts that post four or more times per week see engagement rates 1.6x higher than those posting only once weekly. Additionally, TikTok's algorithm now employs a filtration model, testing content with small groups before scaling its reach. This makes consistency and a clear niche more critical than ever for maintaining visibility.
How to Use TikTok Engagement Rate Calculators
How Engagement Rate Calculators Work
A TikTok engagement rate calculator processes your data - likes, comments, shares, and saves - and divides it by either your follower count or your view count, depending on your preferred method. Once you input your metrics, the tool generates an engagement percentage, which you can use to compare your performance against industry benchmarks.
Not all calculators work the same way. Some leave out metrics like saves and shares, which can underestimate engagement by as much as 40%. Additionally, some tools calculate view count using the average of your last 10 posts, while others rely on the median. The median approach is generally more dependable because it minimizes the impact of outliers, like a single viral video. This variability highlights the importance of selecting a tool that aligns with your goals and delivers consistent results.
What to Look for in a Reliable Calculator
To get accurate insights, opt for calculators that include both follower-based and view-based metrics. These two methods serve different purposes: follower-based metrics are ideal for evaluating overall account health and pitching to brands, while view-based metrics provide a clearer picture of how individual videos perform on the For You Page. Make sure the calculator accounts for all engagement types - likes, comments, shares, and saves. For example, a 3% engagement rate can mean very different things depending on whether you're a Nano creator or a Macro creator.
Some tools also offer scenario modeling, which can be incredibly helpful. This feature lets you experiment with potential changes - like increasing your comment count or boosting shares - to see how they would affect your engagement rate. It’s a great way to plan and refine your content strategy.
How Outfame Improves Engagement Tracking
Accurate tracking is key to growing on TikTok, and Outfame takes engagement calculations to the next level by offering real-time analytics. While static calculators provide a one-time snapshot of your performance, Outfame delivers a continuous view with its real-time growth dashboards. These dashboards track engagement as it happens and provide deeper insights through AI-driven recommendations. You'll learn which content types, posting times, and topics are working best for your account.
For creators and brands looking to grow on TikTok, Outfame eliminates the guesswork. Instead of just knowing whether your engagement rate is high or low, you'll gain context - how your rate compares to others in your niche, how it’s trending over time, and actionable steps to improve. Outfame subscriptions start at $39/month and include a free trial, along with a growth guarantee.
Tips to Improve Your TikTok Engagement Rate in 2026
Content and Posting Strategy Tips
If you're aiming to boost your TikTok engagement, your completion rate is the key metric to watch. For videos under 15 seconds, aim for a completion rate of 70% or higher. For videos between 15 and 30 seconds, a 50%+ completion rate should be your target. If your completion rate drops below 40%, it's a clear sign your hook isn't working.
Speaking of hooks, the first 2–3 seconds of your video are critical. Make sure to put your most eye-catching or emotionally compelling moment right at the start. Hooks like "Project/Product Showcase" and "Comparative Showdowns" perform particularly well, averaging 6,037 and 5,306 views respectively - far above the 1,879-view median. Once you've nailed the hook, focus on making your content shareable. Shares pack 10x the algorithmic punch of a like and saw a 13% increase year-over-year in 2026. Content that feels relatable, sparks opinions, or provides real value is more likely to get shared.
A smart approach to content creation is the 70/30 rule: dedicate 70% of your efforts to proven formats and 30% to experimenting with new ideas. Regularly audit your last 20 posts to identify patterns in your top-performing content - pay attention to hook styles, video lengths, and topics. Use these insights to refine your strategy. And don't forget, your engagement doesn't end when you hit "post." How you interact with your audience afterward plays a huge role in keeping your content visible.
Building a Community That Engages
Creating engaging content is only half the battle; what you do after posting is just as important. Responding to comments within the first 60 minutes signals to TikTok's algorithm that your video is driving meaningful interactions.
When asking your audience to engage, specificity works better than generic prompts. Instead of saying, "Drop a comment below", try asking targeted questions like, "Do you agree?" or "Which would you choose?" These kinds of questions encourage more thoughtful responses. TikTok's native features like Duets and Stitches can also help extend your content's reach while showing the algorithm that your community is active.
"The brands doing this well aren't broadcasting. They're reacting, responding, and showing up in comment sections like actual humans." - Chris Sheen, Director of Social, Celonis
Consistency in your niche is another critical factor. Stick to 3–4 specific content pillars to help TikTok's algorithm understand your account and connect it with the right audience. Posting frequency also matters - accounts that post 4 or more times a week see engagement rates 1.6x higher than those posting just once. However, this only works if your content stays focused and aligned with your niche.
Using Outfame for Data-Driven Growth
Tracking your engagement metrics in real time can make a huge difference in refining your strategy. While it's important to know what to track, having a system that does it for you is even better. Outfame's real-time growth dashboards simplify the process by highlighting key metrics like completion rates, shares, and FYP reach - saving you from manually sifting through TikTok's native analytics.
"The brands that are still growing are the ones treating TikTok less like a content calendar and more like a testing platform." - Tola Janus, Freelance Social Media Manager
Outfame's AI-driven recommendations go a step further by identifying what works specifically for your account, rather than relying on general platform trends. Over time, this helps you pinpoint the content and posting times that truly drive growth - whether that's gaining new followers or increasing shares. Plans start at $39/month and include a free trial with a growth guarantee, making it easier to focus on what matters most: scaling your presence effectively.
Conclusion and Key Takeaways
Recap of Formulas and Benchmarks
When it comes to TikTok engagement rate (ER), two key formulas stand out:
- Follower-based formula: [(Likes + Comments + Shares + Saves) / Followers]
- View-based formula: [(Likes + Comments + Shares + Saves) / Views]
The follower-based formula is ideal for comparing performance with peers or pitching to brands, while the view-based formula works best for evaluating how individual videos perform.
Currently, the median TikTok ER sits at 4.25%, though this varies widely depending on follower count and niche. Nano accounts often outperform larger accounts, and niche-specific benchmarks can significantly influence what qualifies as strong performance. While these formulas and benchmarks are helpful, the real value lies in tracking these metrics consistently over time to uncover actionable insights.
Why Consistency and Context Matter
A single data point doesn’t tell the whole story. The real power of engagement metrics lies in tracking them consistently. This allows you to identify trends and avoid overreacting to temporary spikes or dips. These patterns should inform how you tweak your content strategy.
"TikTok hasn't become less effective - it's just become more demanding. And if you don't adjust your strategy to match that shift, it's very easy to fall behind without even realizing it." - Elena Cucu, Socialinsider
TikTok’s engagement rate has declined 17% since 2024, dropping from 5.10% to 4.25%. But this isn’t a cause for alarm - it’s a sign of the platform’s evolution. Even with this decline, TikTok still generates 2.3x more engagement than the average social media platform. The creators and brands thriving today are those who treat their metrics as a tool for growth, not just a scorecard.
Outfame as a Growth Partner
Turning insights into action is what truly drives success. Throughout this guide, one thing is clear: staying ahead on TikTok requires ongoing analysis and adjustments. Outfame simplifies this process with real-time dashboards and AI-driven recommendations. Whether it’s fine-tuning your posting schedule, doubling down on a specific content theme, or identifying which videos are attracting new followers, Outfame helps you connect your engagement data to actionable strategies. Plans start at $39/month and include a free trial, backed by a growth guarantee.
FAQs
Should I use follower-based or view-based ER?
When evaluating video performance and refining your content strategy, the view-based engagement rate is a valuable metric. It shows how effectively your content reaches and engages viewers beyond your follower base. On the other hand, the follower-based engagement rate provides insight into your account's overall performance and how it stacks up against industry standards. Each approach offers unique insights, so the choice depends on your specific goals and what you aim to analyze.
How many videos should I average for ER?
To keep a solid TikTok engagement rate in 2026, aim for posting 1 to 3 videos per week. The best posting frequency often depends on your follower count. Smaller accounts tend to benefit from posting more regularly, as consistent activity helps build momentum. Just remember: quality matters as much as consistency. High-quality, engaging content will always perform better than frequent, uninspired posts.
Why is my ER lower as I grow?
As your follower count increases, you might notice your engagement rate (ER) starting to dip. This happens because of audience dilution - a larger, more varied audience tends to engage less compared to a smaller, highly targeted one. Plus, TikTok’s algorithm emphasizes pushing content to non-followers, which can also contribute to a lower ER over time.
To keep your engagement strong, concentrate on crafting content that people want to share or save. And don’t forget to stay active with your audience - reply to comments, ask questions, and make them feel involved. It’s all about building that connection!


