If I had to sum it up in one line: Instagram helps me pick posting windows, while TikTok helps me test posting rhythm.
If I’m trying to decide when to post, I look at follower activity first. If I’m trying to decide how often to post, I look at watch time, completion signals, and how posts perform in the first hour. That’s the core difference here.
Here’s what matters most:
- Instagram shows follower activity by day and hour, plus reach, saves, shares, and results by format
- TikTok shows hourly follower activity, watch time, average view duration, completion signals, and territory data
- Both platforms use early engagement in the first hour to help decide how far a post goes
- Instagram gives me a longer native history window and longer native scheduling range
- TikTok gives me tighter timing signals for short-form video testing
- Neither platform tells me the exact perfect time to post next week
If you want the short answer: use Instagram to spot broad posting windows, use TikTok to test tighter time slots and posting frequency, and retest every 3–6 months.
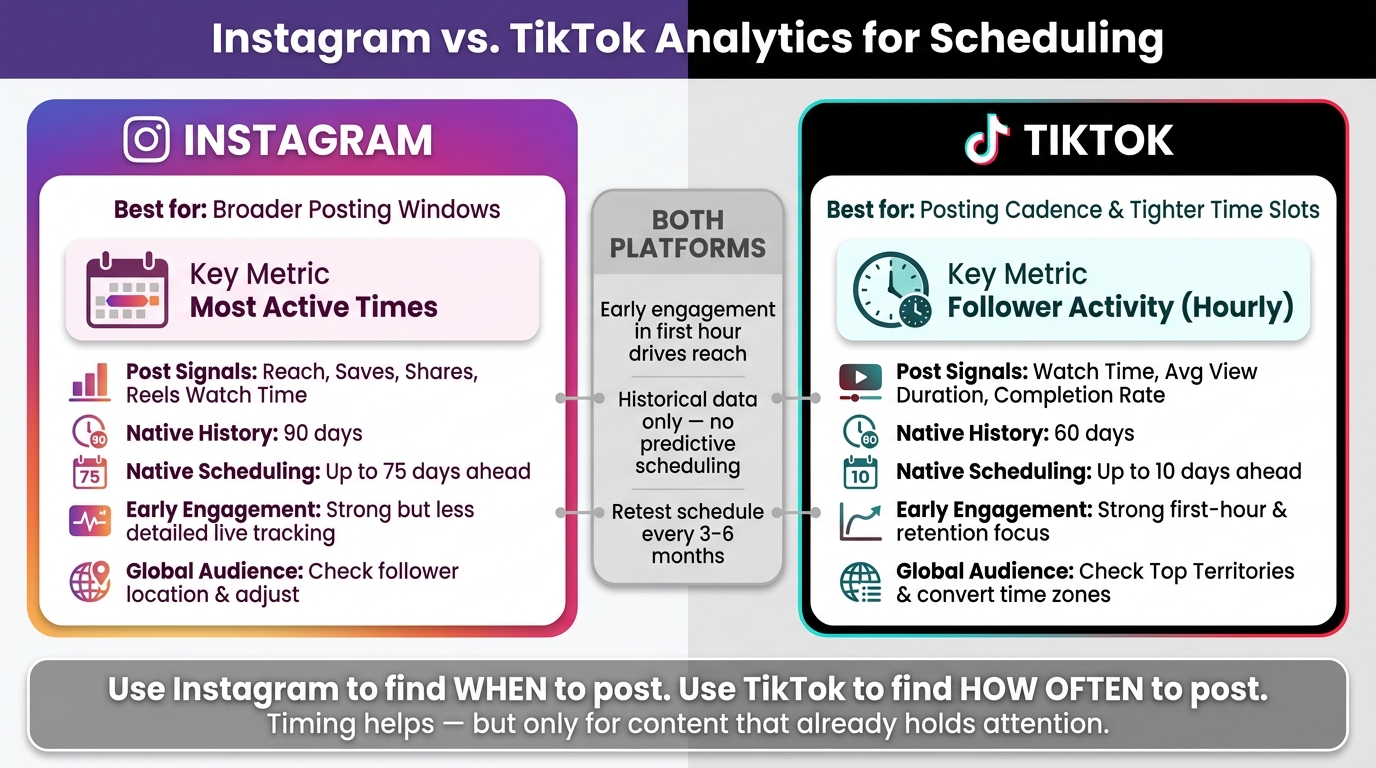
Instagram vs. TikTok Analytics for Scheduling: Side-by-Side Comparison
Quick Comparison
| Criteria | TikTok | |
|---|---|---|
| Best for | Broader posting windows | Posting cadence and tighter time slots |
| Main timing view | Most Active Times | Follower Activity |
| Best post-level signals | Reach, saves, shares, Reels watch time | Watch time, average view duration, completion rate |
| Native history | Up to 90 days | Up to 60 days |
| Native scheduling | Up to 75 days ahead | Up to 10 days ahead |
| Early performance focus | Strong, but less detailed live tracking | Strong first-hour and retention focus |
| Global audience handling | Check follower location and adjust | Check Top Territories and convert time zones |
My takeaway is simple: timing helps, but it only boosts posts that already hold attention. So I’d use analytics to pick time slots, then judge those slots by watch time, shares, saves, comments, and repeat patterns over the last 30–60 days.
sbb-itb-3b12fba
Instagram Analytics for Scheduling Posts
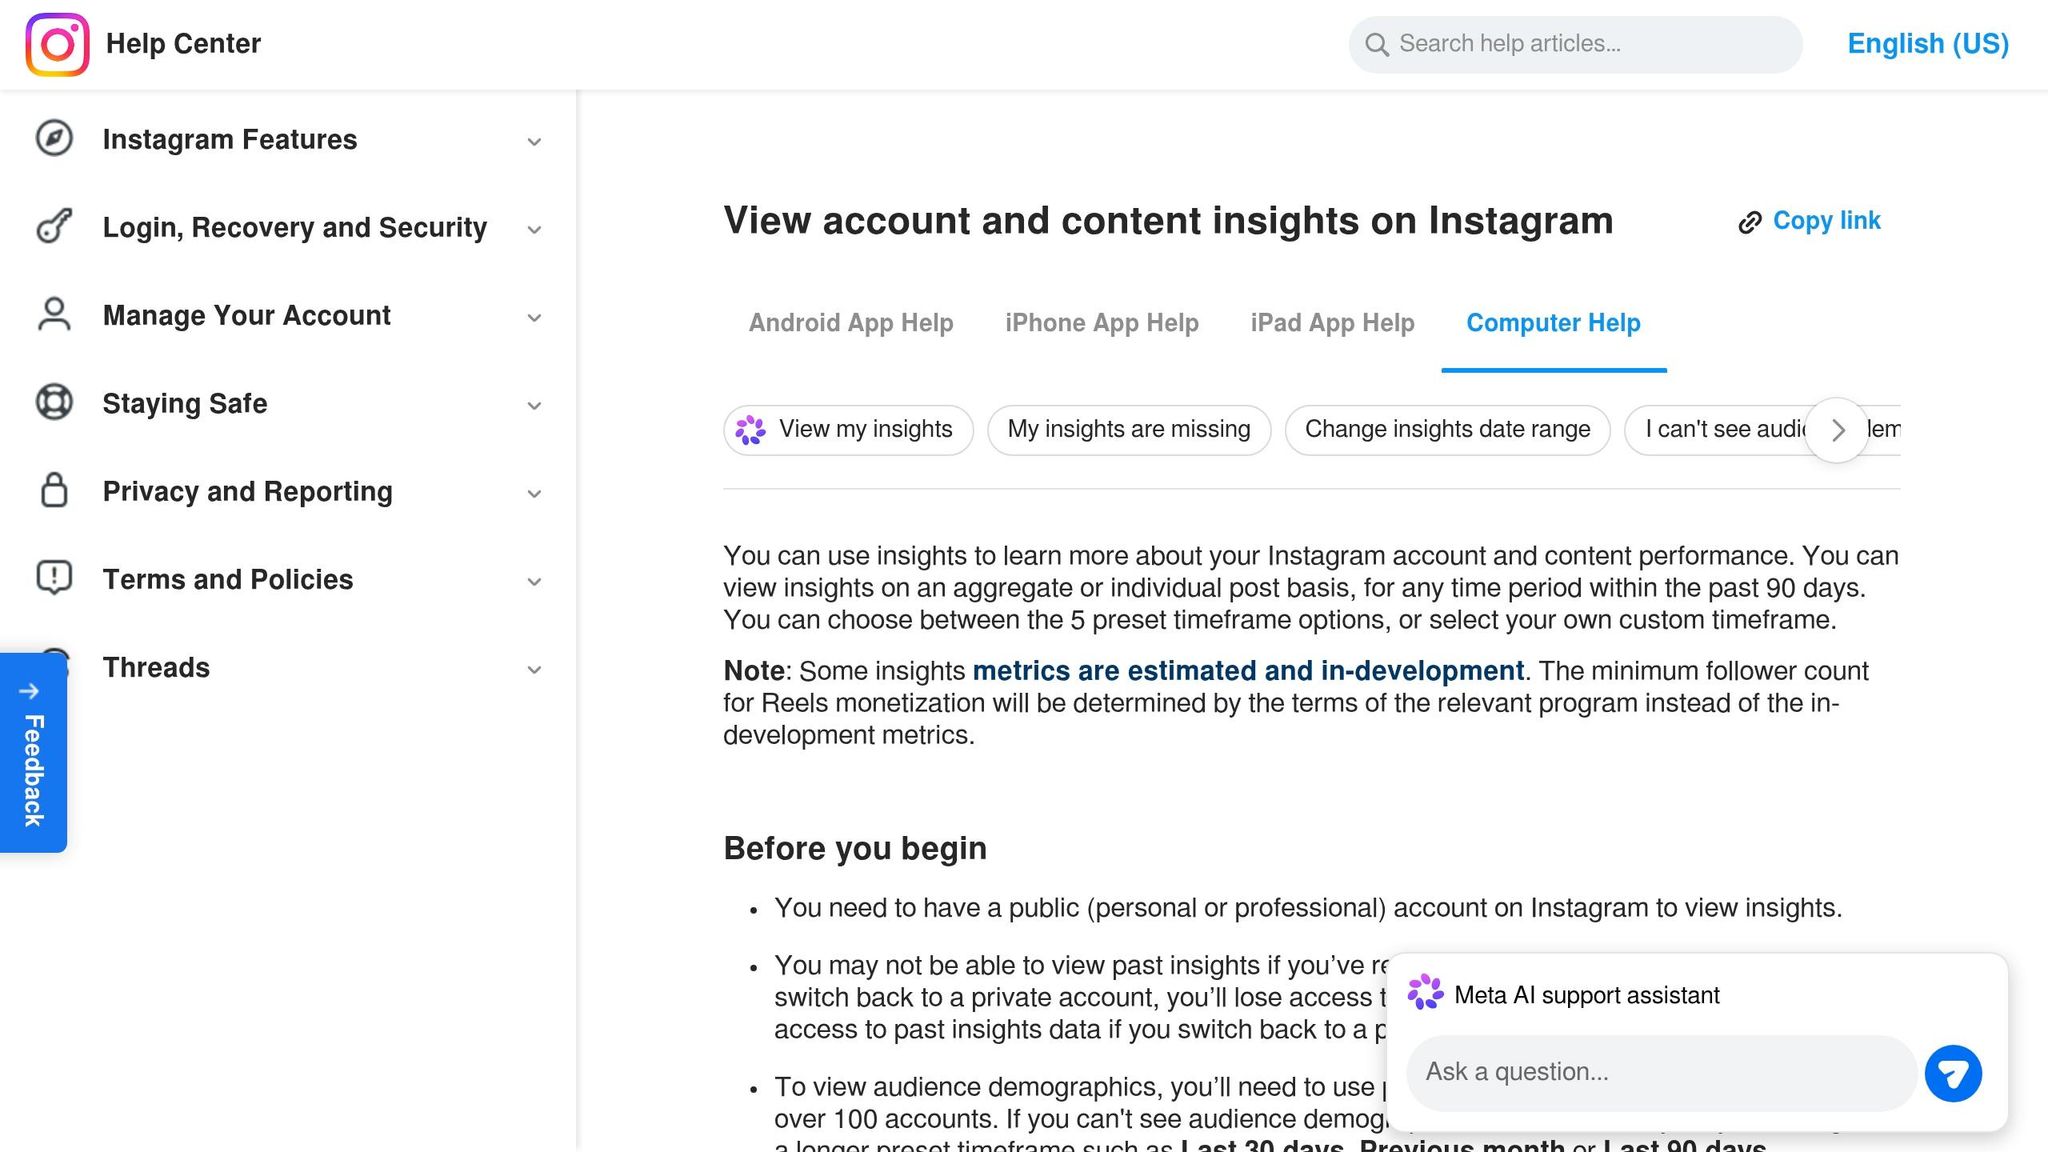
Instagram Insights gives you a useful look at follower activity through Most Active Times under Total Followers, plus hourly, daily, location, and age data. The location data matters more than it may seem at first. If a big part of your audience is in another time zone, posting when you’re awake might mean posting while they’re asleep.
That said, Instagram is much better at helping you fine-tune a posting schedule than telling you exactly what to do next.
Audience Activity and Timing Data in Instagram Insights
The Most Active Times chart shows when your audience is online. That makes it the first place to look when you’re trying to pick posting windows on Instagram.
Format matters too. Reels usually do better when you publish them 15–30 minutes before peak activity. Stories work a bit differently. Posting them in the morning gives them more time to pick up views across the day.
Post and Reel Metrics That Help Refine a Schedule
Audience activity is only part of the picture. To tighten your schedule, you also need to look at how each post performs.
Instagram Insights tracks accounts reached, impressions, likes, comments, shares, saves, and content interactions, with separate breakdowns for feed posts, Reels, and Stories.
A simple way to use that data: review your top Reels and feed posts from the last 30 to 60 days and compare their publish times. If the same time blocks keep showing up in your best performers, that’s a strong signal worth testing again.
Instagram Analytics: Strengths and Limits for Scheduling
Instagram Insights gives you solid raw material for building a schedule. But it also has some clear gaps.
The biggest one is that the data is historical, not predictive. In plain English, it tells you what already happened, not what is most likely to work next week. Instagram also doesn’t give you a built-in best-time-to-post suggestion.
| Strengths | Limitations |
|---|---|
| Follower activity by day and hour | Historical data only, typically limited to the last 30–90 days |
| Separate metrics for feed posts, Reels, and Stories | No native predictive scheduling recommendations |
| Tracks non-follower reach to measure discovery | Limited real-time performance tracking |
| Native scheduling for feed posts and Reels up to 75 days in advance |
There’s another catch here: the early-engagement window. If a scheduled post goes live while you’re away from your phone, you may miss early comments and replies. That can slow down momentum right when the post starts getting seen.
TikTok Analytics handles timing a bit differently, with more focus on hourly follower trends and video-level performance.
TikTok Analytics for Scheduling Posts
TikTok handles timing a bit differently from Instagram. On TikTok, timing and retention are closely linked. If a post performs well in its first hour, the platform may push it farther. If it stumbles early, reach can stall out fast.
That’s why TikTok analytics are often better for cadence decisions. Instagram analytics, by contrast, tend to be better for picking posting windows.
Follower Activity and Hourly Trends in TikTok Analytics
In Analytics → Followers → Follower Activity, TikTok shows when your followers are active by hour and by day. That’s much more useful than generic “best time to post” advice because it reflects your audience, not a platform average.
The Top Territories section adds another layer. It shows where your followers are based. If a big chunk of your audience is in a different time zone, you’ll need to convert those peak hours to your local time on your own.
A simple rule: publish 30 to 60 minutes before your peak window. That gives the video time to go live and start moving through distribution before your followers pile in. Broad benchmarks can help at the start, but your Follower Activity data should shape the actual schedule.
Video-Level Metrics That Influence Posting Cadence
TikTok tracks total watch time, average watch duration, likes, comments, shares, and favorites for each video. Focus first on watch time and completion rate. After that, look at favorites, shares, and comments. Likes matter least.
If a certain time slot keeps boosting watch time and favorites, use it again. A peak hour only helps if the video can hold attention.
TikTok Analytics: Strengths and Limits for Scheduling
TikTok gives creators very useful video-first data for scheduling, especially around retention and early momentum. But there are limits too, especially if you manage a global audience or depend on scheduled posting.
| Strengths | Limitations |
|---|---|
| Hourly follower activity data helps pinpoint peak posting windows | Time-zone interpretation is manual for global audiences |
| Watch time and completion rate show whether a slot attracts high-intent viewers | Native scheduling only allows planning up to 10 days in advance |
| Top Territories data helps you adjust for international audiences | Historical habits can shift, so schedules need to be re-tested every 3–6 months |
| Early engagement data helps assess momentum in the first hour | Scheduled posts can miss an active session in the app |
There’s also a practical catch with scheduling. If you publish a post and then step away from the app, you may miss that first hour when momentum starts to build. Replying to early comments helps keep the video connected to an active session.
These differences set up the side-by-side comparison of which platform gives clearer scheduling guidance.
Instagram vs. TikTok Analytics for Scheduling: Side-by-Side Comparison
Both platforms show follower activity. But they help in different ways.
Instagram is better for picking posting windows.
TikTok is better for testing posting cadence.
Once you map the native metrics, the next step is simple: figure out which platform turns that data into clearer scheduling calls.
Comparison Table: Scheduling Data, Clarity, and Usability
The differences stand out fast when you put them side by side.
| Feature | Instagram Insights | TikTok Analytics |
|---|---|---|
| Follower activity granularity | Day and hour breakdowns | Hourly, daily, and weekly breakdowns |
| Key scheduling metric | Most Active Times | Follower Activity |
| Post-level metrics for timing | Reach, saves, shares, and Reels watch time | Watch time, average view duration, and completion rate |
| Historical data window | Up to 90 days (native) | Up to 60 days |
| Real-time tracking | Limited | More detailed |
| How long posts keep gaining traction | Around 48 hours | Can resurface weeks later |
| Native scheduling range | Up to 75 days in advance | Up to 10 days in advance |
Which Platform Offers Better Native Scheduling Guidance
Scheduling usually comes down to two things: when to post and how often to post.
For the first, TikTok has the edge. Its hourly follower activity data is more exact. Instagram's Most Active Times chart still helps, but it tends to point to a broader window instead of a tighter slot.
For the second, Instagram gives you more room to spot patterns. You get up to 90 days of native history, which makes it easier to see what keeps working and shape a steady posting plan. TikTok gives you a shorter data window, but its real-time tracking moves faster. So if a time slot starts slipping, you can catch it sooner.
If you're trying to build a repeatable short-form video schedule, TikTok often gives clearer signals. Metrics like completion rate and average view duration show more than timing alone. They also hint at which video formats deserve another run. On TikTok, posting time matters, but how well a video holds attention in that first hour can matter even more.
Instagram, on the other hand, does a better job surfacing action-based signals like saves, shares, and website taps.
Next, use these signals to test and refine one posting schedule.
How to Build a Better Posting Schedule Using Both Platforms
A 4-Step Process for Testing and Adjusting Your Schedule
Turn your analytics into a posting plan you can repeat. Once you know which platform gives you the clearest timing signals, use that data to run a simple test and stick to it.
- Pull your data: Check Instagram Insights and TikTok Analytics for the past 30–60 days. Focus on patterns that show up more than once, not random spikes. Instagram Insights is the better place to start for broader time ranges. TikTok Analytics works better for tighter posting rhythm checks.
- Pick three test windows: Choose one morning slot, one midday slot, and one evening slot based on what your analytics show.
- Run a 3-week test: Test one format for 3 weeks so timing stays the only variable. That way, you’re not mixing timing results with format changes.
- Score and lock in your schedule: Rank each time slot by watch time, shares, saves, and comments. Then use your top two slots next month. After that, retest every 3–6 months as audience habits change.
When Real-Time Analytics Tools Can Speed Up Scheduling Decisions
Native analytics give you the baseline. Real-time tools help you spot when that baseline starts to move.
TikTok’s analytics, for example, can lag by 24–48 hours, which makes it harder to react when a posting time starts to slip. That delay matters. If a slot is falling off, waiting one or two days to notice can slow down your next move.
Outfame offers real-time analytics and 24/7 growth monitoring across both Instagram and TikTok, which makes it easier to catch performance changes as they happen instead of days later. A simple way to use both: set your baseline with native analytics, then use real-time monitoring to spot shifts faster.
Conclusion: Key Takeaways for Instagram vs. TikTok Scheduling
After one full test cycle, the pattern should be easier to read. Instagram works better for broader scheduling windows. TikTok works better for faster cadence checks. Use native analytics as your starting point, then adjust based on performance data instead of general posting advice.
"Consistency beats perfect timing. Algorithms favor accounts that post regularly." - Later
FAQs
Which metrics matter most for scheduling?
For both Instagram and TikTok, the scheduling metrics that matter most are audience activity and early engagement.
Start with the basics: check when your followers are most active. Then watch how each post performs right after it goes live. That early response tells you a lot about whether your timing is working.
Pay close attention to signals like reach, saves, likes, comments, shares, completion rate, and watch time. Over time, posting at consistent times makes these patterns easier to spot and use.
How often should I retest posting times?
Retest posting times every 1 to 3 months. For most accounts, a quarterly check is enough. Early-stage creators may want to review things monthly, since their audience can shift faster.
Run a new test sooner if your audience moves to a new location, you switch content formats, or engagement slips for several weeks without a clear reason.
What should I do if my audience is in multiple time zones?
Check your platform insights to see when your followers are most active. Then post during the time blocks where the biggest parts of your audience overlap.
A simple way to do this is to pick one or two main posting windows in your key time zone, such as 12–1 PM or 7–8 PM. That gives you a steady rhythm instead of posting at random.
If your audience is spread across different regions, you can also stagger posts so each group sees content closer to its own peak hours. From there, watch your analytics and keep adjusting the schedule based on what the data shows over time.


