
Instagram engagement metrics show how much your audience interacts with your content. These include likes, comments, saves, and shares. Unlike follower count, which only reflects potential reach, engagement metrics measure actual audience interest.
Here’s why they’re important:
- Instagram’s algorithm prioritizes posts with strong early engagement, pushing them to more users.
- Brands value creators with higher engagement rates over large follower counts.
- Tracking these metrics helps refine content strategies based on what resonates.
In 2026, the average engagement rate across Instagram is 0.45%, but smaller accounts often perform better, with niche creators achieving up to 5% or more. To measure engagement, you’ll need to combine actions (likes, saves, etc.) with context metrics (followers, reach, impressions).
The most common formula is:
(Total Engagements ÷ Followers) × 100
This is useful for comparing performance or pitching to brands. Other formulas, like engagement by reach or impressions, offer deeper insights for organic and paid content.
Key Metrics to Track:
- Saves: Highest value, showing intent to revisit.
- Shares: Indicate virality and relatability.
- Comments: Reflect deeper audience engagement.
- Likes: A lighter signal of interest.
To access these metrics, switch to a Professional account and use Instagram Insights. For long-term tracking, export data regularly or use tools like Outfame for advanced analytics.
Takeaway: Engagement metrics are critical for understanding audience behavior, improving content, and staying competitive on Instagram.
4 Instagram Growth Metrics every business needs ( Analytics Guide )
sbb-itb-3b12fba
Key Instagram Engagement Metrics You Need to Track
When analyzing Instagram performance, it’s crucial to know exactly what you’re measuring. Instagram metrics fall into two categories: engagement actions and context metrics. Together, they help paint a complete picture of how your content is performing.
Engagement Actions
There are four primary engagement actions: likes, comments, shares, and saves. As of 2026, Instagram’s algorithm evaluates these interactions differently. For instance, saves are considered the strongest indicator of quality because they show intent to revisit the content later. Shares are also highly valued, as they expand your content’s reach beyond your follower base.
Comments, especially those with more than four words, indicate meaningful interaction and community engagement. Meanwhile, likes are now seen as a lighter signal of interest, particularly for Reels. Secondary actions, such as story replies, poll taps, and direct messages (DMs), also contribute to engagement, though they’re harder to quantify.
"Saves are particularly valuable – a save signals strong content quality and boosts algorithmic distribution more than a like does." - Ana Tyshchenko, Content Strategist, Kontentino
Here’s a quick breakdown of how these metrics rank in importance:
| Metric | Relative Importance | What It Signals |
|---|---|---|
| Saves | Highest | Lasting value, intent to revisit |
| Shares | Very High | Recommendation, virality |
| Comments | High | Conversation, community depth |
| DMs | Growing | Deep personal engagement |
| Likes | Low | Casual interest, low intent |
While these actions are critical, understanding the context behind them is just as important.
Context Metrics
Engagement actions alone don’t tell the whole story. Context metrics - like followers, reach, and impressions - provide the scale needed to make sense of raw numbers. For example, 200 comments might seem impressive, but their significance depends on the size of your audience. If your post reached 500,000 people, that same number of comments might indicate a low engagement rate.
Among these context metrics, reach is often the most insightful for organic content, as it reflects the number of unique users who saw your post. These metrics act as denominators that transform raw interaction data into meaningful percentages.
Engagement Rate Formula
To measure engagement effectively, you need to combine both action and context metrics. The standard formula is:
(Total Engagements ÷ Audience Metric) × 100
Here, "Total Engagements" includes likes, comments, shares, and saves. The "Audience Metric" can vary - followers, reach, or impressions - depending on your goals. Each version of the formula serves a different purpose:
| Formula Type | Calculation | Best Use Case |
|---|---|---|
| ER by Followers (ERF) | (Total Engagements / Total Followers) × 100 | Competitive benchmarking and influencer vetting |
| ER by Reach (ERR) | (Total Engagements / Total Reach) × 100 | Measuring content quality and organic performance |
| ER by Impressions (ERI) | (Total Engagements / Total Impressions) × 100 | Analyzing paid campaigns and ad fatigue |
Choosing the right formula depends on what you’re trying to measure, whether it’s organic content quality, audience engagement, or the effectiveness of paid campaigns.
How To Access Instagram Insights
Instagram Insights is a free analytics tool built into Instagram for Professional accounts (Business or Creator). If you're using a personal account, you won't be able to view any analytics data. Getting started with Insights is the first step to applying engagement rate formulas and tracking metrics, as discussed earlier.
Setting Up a Professional Instagram Account
Switching to a Professional account is quick and easy. Open the Instagram app, go to your profile, tap the menu (three horizontal lines), and select Settings → Account type and tools → Switch to professional account. From there, choose a category that fits your work - options include "Digital Creator" or "Clothing Brand" - and decide between a Creator or Business account.
- Creator accounts: Ideal for influencers, public figures, and personal brands.
- Business accounts: Designed for brands and organizations needing features like contact buttons, ad capabilities, and conversion tracking.
Once you've set it up, give Instagram 24–48 hours to activate your Insights dashboard. After activation, you'll have access to valuable performance metrics.
Navigating Instagram Insights
Once you’ve switched to a Professional account, you can access Insights by tapping "Professional Dashboard" on your profile page. The dashboard is divided into three sections:
- Overview: Summarizes your account’s performance.
- Content You Shared: Breaks down metrics for individual posts, Reels, and Stories.
- Total Followers: Provides insights into your audience demographics and growth.
For specific posts or Reels, tap "View Insights" below the content. To check metrics for Stories, swipe up while the Story is live or find expired data in the Archive section. Keep in mind that post-level data may take up to 24 hours to stabilize, so wait before analyzing performance.
"You cannot improve what you don't measure. Instagram Insights provides the measurements for free." - Michael Anderson, Instagram Analytics Specialist, Instatrackr
Exporting and Logging Your Data
Instagram Insights only retains account-level data for 90 days. To track trends over time, manually record key metrics - like Reach, Accounts Engaged, and Profile Visits - into a spreadsheet each month. Also, note your top 3–5 performing posts and evaluate what contributed to their success.
If you want to keep a longer history of your analytics, consider third-party tools like Outfame, which offers real-time tracking and continuous monitoring of growth metrics.
How To Calculate Instagram Engagement Rates
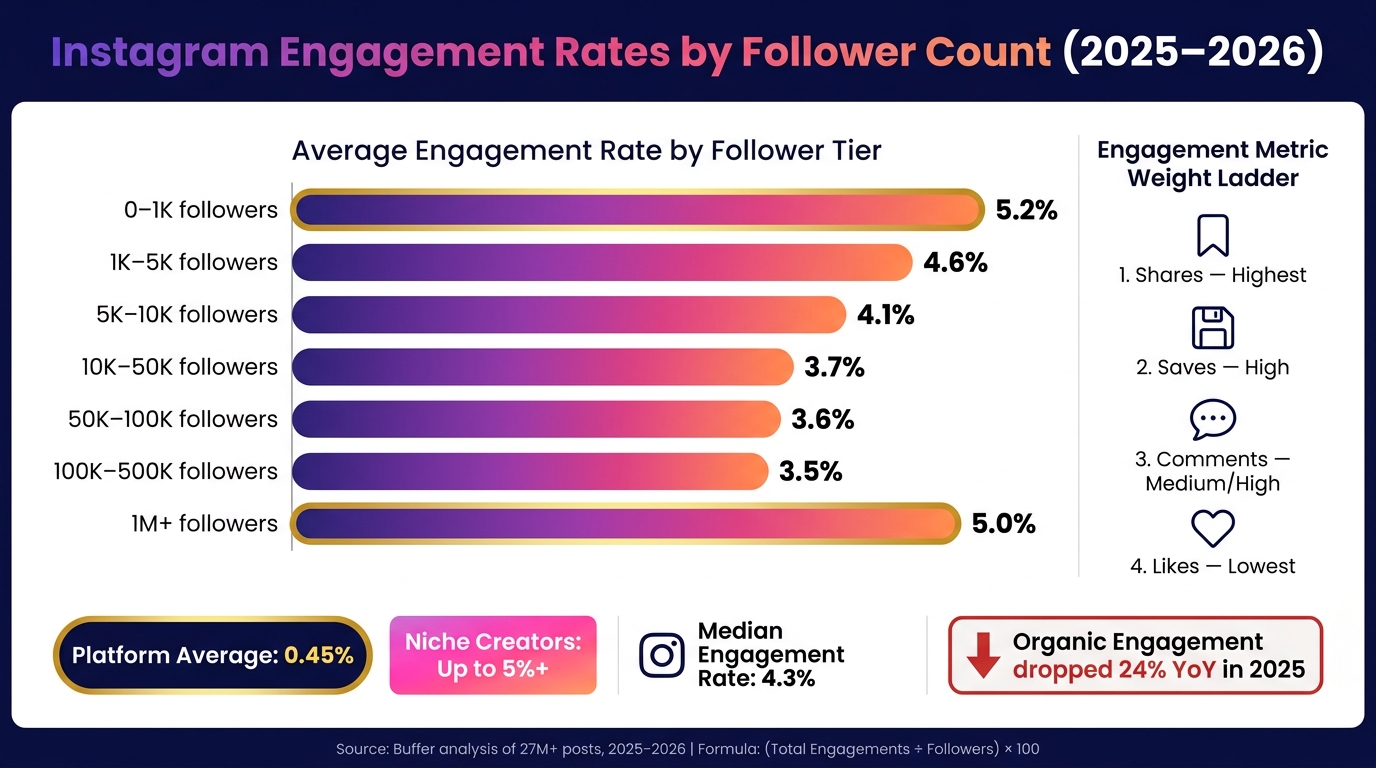
Instagram Engagement Rates by Follower Count (2025–2026)
Turning Instagram Insights into actionable engagement percentages is easier with a few clear formulas. Let’s break down four methods you can use to measure engagement.
Engagement Rate by Followers
This is the most common formula: (Total Engagements ÷ Total Followers) × 100. Total engagements include likes, comments, saves, and shares.
For example, if a post gets 250 engagements and your account has 10,000 followers, your engagement rate is 2.5%. To give you some context, here’s how engagement rates typically vary by account size in 2025/2026:
| Follower Tier | Average Engagement Rate |
|---|---|
| 0 – 1K | 5.2% |
| 1K – 5K | 4.6% |
| 5K – 10K | 4.1% |
| 10K – 50K | 3.7% |
| 50K – 100K | 3.6% |
| 100K – 500K | 3.5% |
| 1M+ | 5.0% |
This formula works well for comparing your account to competitors, building a media kit, or tracking your audience's loyalty. However, keep in mind that fake or inactive followers can skew these numbers, making your engagement rate look lower than it actually is.
"Follower count tells you how many people could see your content. Engagement rate tells you how many actually care." - Ana Tyshchenko, Kontentino
Engagement Rate by Reach
This method focuses on the people who actually saw your post rather than your total followers. The formula is: (Total Engagements ÷ Reach) × 100, where Reach is the number of unique accounts that viewed your post.
Since not all your followers see every post, this calculation gives a more accurate picture of how your content resonated with those who did. It’s particularly useful for testing new content formats or evaluating creative quality, especially when experimenting with Reels or Explore placements.
Engagement Rate by Impressions and Views
For a deeper dive, consider Engagement Rate by Impressions (ERI): (Total Engagements ÷ Impressions) × 100. Unlike reach, impressions count all views, including repeat ones, so ERI tends to be lower. This method is especially handy for paid ads, helping you spot trends like ad fatigue - when impressions rise but engagements stay flat.
For video content, use Engagement Rate by Views (ERV): (Total Engagements ÷ Video Views) × 100. This metric shows how viewers are interacting relative to total video plays. Keep in mind that repeat views by the same user can lower the percentage, but that doesn’t necessarily mean interest is dropping.
Time-Based Engagement Rates
Want to track trends over time? Try time-based engagement rates. The Daily Engagement Rate formula is: (Total engagements in a day ÷ Total followers) × 100. Monitoring this weekly can help you spot sudden changes, like dips caused by algorithm shifts or content fatigue.
For a broader view, calculate the average engagement rate across your last 10 or 30 posts. Add up the engagement rates for each post, then divide by the number of posts. Comparing groups of posts (e.g., posts 1–10 vs. 11–20) can highlight whether your strategy is improving, holding steady, or losing traction. Monthly audits can also reveal long-term performance patterns.
How To Track and Read Specific Engagement Metrics
Understanding the meaning behind each metric and knowing where to find them on Instagram is key to refining your content strategy.
Likes, Comments, Shares, and Saves
Once you've calculated your engagement rate, it's time to dive deeper into individual interactions to fine-tune your approach.
You can access these metrics for any post by tapping "View Insights" below it. For Reels, click the "..." icon. For a broader view, head to your professional dashboard and check the "Content You Shared" section. This allows you to filter and rank posts by specific interaction types over the past 90 days.
Instagram groups likes, comments, saves, and shares under "Interactions", but they don't all carry the same weight. Here's how each one contributes differently to your strategy - and to Instagram's algorithm:
| Metric | What It Reveals | Algorithmic Weight |
|---|---|---|
| Likes | General approval; low-effort reaction | Lowest |
| Comments | Community interest; willingness to engage | Medium/High |
| Saves | High utility; content worth revisiting | High |
| Shares | Relatability; content worth sharing | Highest |
Pro Tip: End your captions with a clear, specific question to encourage comments. For boosting saves, try creating educational carousels or checklists - these formats often perform better, and aiming for a saves-to-reach ratio of 6% or higher is a solid benchmark.
Story Interactions and Profile Actions
Stories bring their own set of metrics. For active Stories, swipe up to view real-time data. For archived Stories, go to Insights → Content You Shared. Focus on replies, sticker taps (like polls, sliders, or question boxes), and shares - these actions indicate active engagement rather than passive scrolling.
Profile actions, such as website taps, bio link clicks, and profile visits, measure conversion intent. If you notice high profile visits but no growth in followers, it might be time to rethink your bio or grid layout to better convert visitors into followers.
Also, don’t just look at immediate post interactions. Keep an eye on how your overall follower trends align with these engagement metrics.
Follower Growth vs. Engagement
Your follower count reflects your potential reach, but your engagement rate shows how much your audience actually connects with your content. A large following with low engagement can lead to what’s known as the "Follower Liability Effect" - the algorithm interprets low interaction as a lack of interest, which can hurt your reach even further.
Currently, the median Instagram engagement rate is 4.3%, while the median monthly follower growth rate is 3.3% (based on Buffer's analysis of over 27 million posts, 2025–2026). If your engagement rate is strong but your follower growth is stagnant, try adding clear follow calls-to-action (CTAs) and pinning your best-performing posts to encourage more people to hit that follow button.
Using Tools for Advanced Analytics
While Instagram Insights provides a solid starting point, it has its limitations - such as no tracking for DMs, no revenue attribution, and only 90 days of data. For a more comprehensive view, tools like Outfame can fill in the gaps.
Outfame offers 24/7 real-time growth monitoring and automated engagement tracking, saving you the hassle of manually pulling data. Their live analytics dashboard helps creators and brands respond quickly to audience trends, especially when engagement dips unexpectedly. Pricing starts at $39/month, and they even offer a free trial with a growth guarantee if results fall short.
Picking the Right Engagement Metrics for Your Goals
Once you’ve figured out how to calculate different engagement rates, the next step is deciding which one fits your objectives. The key is to align your chosen metrics with your specific goals - whether that's proving value to a brand, fine-tuning your strategy, or assessing the performance of paid campaigns.
Which Metric To Use and When
The right metric depends on both your audience and the goals you’re trying to achieve.
- Engagement Rate by Followers (ERF): This metric uses your follower count and is perfect for media kits or brand pitches. When brands ask for your engagement rate, they’re usually referring to this one.
- Engagement Rate by Reach (ERR): This acts as an internal performance tracker, focusing on interactions from people who actually saw your post. It’s great for tweaking content formats and identifying areas where your posts might be falling short.
- Engagement Rate by Impressions (ERI): Designed for paid content, this metric helps you monitor ad fatigue and evaluate how efficiently your advertising dollars are being spent.
For educational content, the Save-to-Like Ratio is especially important. Ideally, you should aim for 1 save for every 3–5 likes. If your ratio is closer to 1 save per 20 likes or more, it might suggest that while your content gets quick reactions, it may not be offering lasting value.
Here’s a quick comparison to help you decide which metric works best for your needs:
Engagement Metrics Comparison Table
| Metric | Formula | Best Use Case |
|---|---|---|
| ER by Followers (ERF) | (Total Engagements ÷ Followers) × 100 | Brand pitches, media kits, competitor benchmarking |
| ER by Reach (ERR) | (Total Engagements ÷ Reach) × 100 | Internal content reviews, comparing post formats |
| ER by Impressions (ERI) | (Total Engagements ÷ Impressions) × 100 | Paid campaigns, monitoring ad fatigue |
| Save-to-Like Ratio | Total Saves ÷ Total Likes | Evaluating the long-term value of educational content |
| Saves Rate | (Saves ÷ Reach) × 100 | Spotting high-utility, retention-focused content |
When analyzing these metrics, it’s best to base your benchmarks on at least 30 posts. Relying on a single viral post can skew your averages and give you misleading results.
Conclusion: Keeping Up With Your Instagram Engagement Metrics
Tracking your Instagram performance is not something you can set and forget. It's a habit that requires consistency. Metrics like engagement rate by followers or save-to-like ratios only become actionable when you monitor them regularly. With organic engagement on Instagram dropping 24% year-over-year in 2025, staying on top of your numbers is no longer optional - it's essential if you want to remain competitive.
A simple review schedule can keep you on track. Dedicate 15 minutes weekly to check reach and engagement rates, 30 minutes monthly to review growth trends, and a quarterly audit to assess the bigger picture. Make sure your analysis is based on a solid sample - at least 30 posts - to avoid being misled by outliers.
This consistent monitoring is what sets apart creators who merely follow trends from those who predict them. It's the cornerstone of a solid Instagram strategy.
To make tracking easier, tools like Outfame can automate much of the process. Outfame offers real-time analytics and 24/7 growth monitoring, so you’re not left guessing between your regular check-ins. Plans start at $39/month, and they include a free trial with a money-back guarantee if the results don’t meet your expectations.
In 2026, successful Instagram creators focus on tracking the right metrics and reviewing them consistently. By building these habits into your routine, you’ll keep your strategy aligned with the platform’s ever-changing demands.
FAQs
Which engagement rate formula should I use?
The right formula to measure engagement depends on what you're aiming to achieve:
- If you're working on media kits or benchmarking, the formula is: (Total Engagements / Total Followers) × 100.
- To evaluate content quality or algorithm performance, use: (Total Engagements / Reach) × 100.
- When analyzing paid content or audience saturation, go with: (Total Engagements / Impressions) × 100.
Make sure to factor in likes, comments, saves, and shares to get a full picture of how your audience is interacting.
What counts as “total engagements” on Instagram?
On Instagram, total engagements cover all the ways users interact with your content - likes, comments, saves, and shares. Depending on specific goals, some marketers might also include story replies, profile visits, or link clicks in this calculation. Tools like Outfame dive into these interactions to provide a weighted engagement rate, giving you a clearer picture of how active and engaged your audience really is.
How do I track engagement beyond 90 days?
Instagram's built-in analytics only save data for 90 days. If you want to track engagement over a longer period, consider using third-party analytics tools. These tools can store your metrics continuously, making it easier to analyze trends and compare performance over time. Keeping a close eye on your data regularly can help you spot changes and fine-tune your content strategy for better results.


