Want to improve your social media strategy? Start by analyzing your competitors' engagement metrics. This approach helps you understand what’s working in your niche and identifies areas where your content could perform better.
Here’s what you’ll learn:
- Key metrics to track: likes, comments, shares, saves, and video views.
- How engagement rates differ on Instagram and TikTok.
- Steps to identify and monitor the right competitors.
- Tools and methods to gather and analyze data effectively.
- How to spot performance patterns and optimize your content strategy.
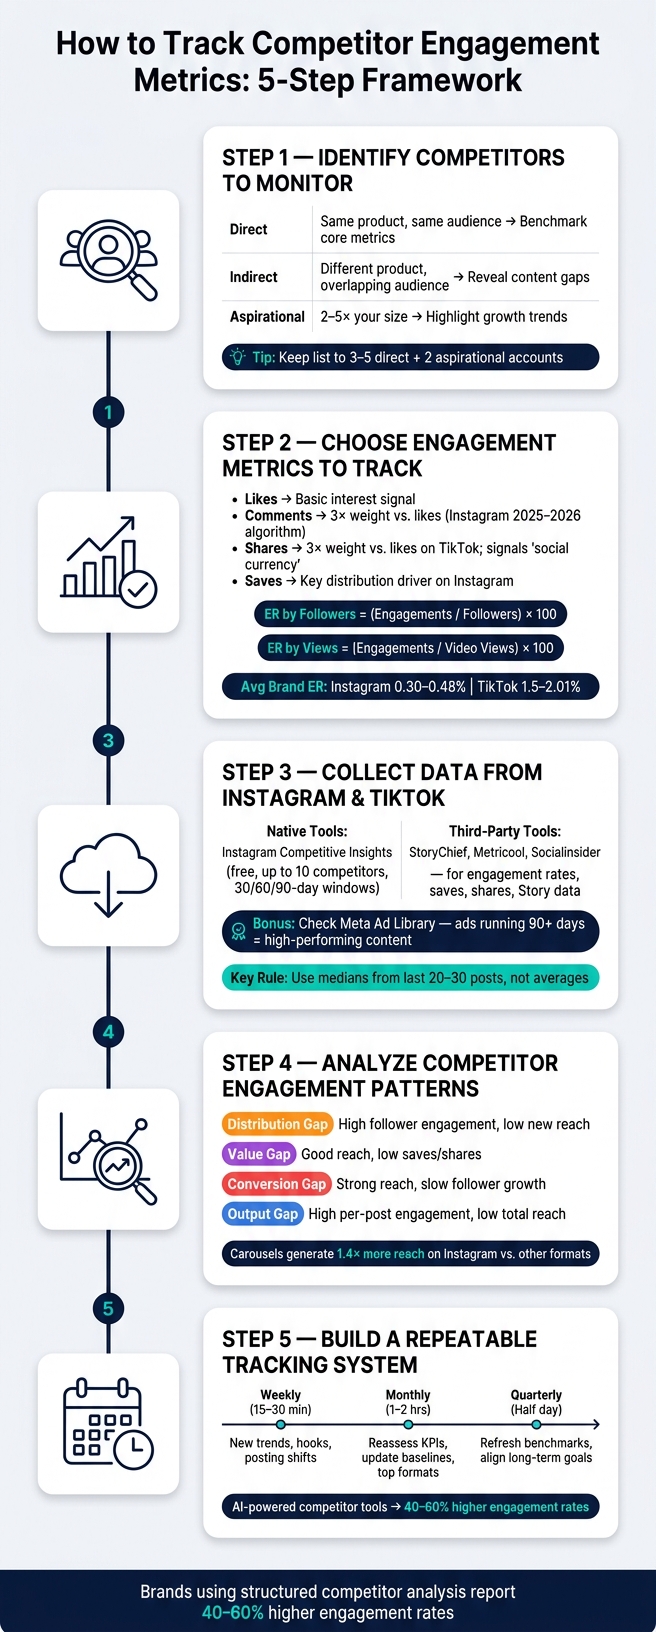
How to Track Competitor Engagement Metrics: 5-Step Framework
How to Analyze Your Social Media Metrics and Track Competitors | METRICOOL TUTORIAL
sbb-itb-3b12fba
Step 1: Identify Competitors To Monitor
Now that you have key engagement metrics in hand, it’s time to pick the competitors you’ll benchmark against. The goal here is to focus on accounts that provide meaningful comparisons to your own performance.
How To Choose Direct Competitors
A direct competitor is someone targeting the same audience, using similar content formats, and working within your niche. For example, if you run a vegan recipe account, your direct competitors would be other vegan food creators - not general cooking channels. Comparing yourself to broader accounts can throw off your benchmarks and lead to inaccurate insights.
When evaluating competitors, look for overlaps in audience demographics, content styles, and business goals. Instagram’s "Competitive Insights" tool is a great starting point for Business and Creator accounts, accessible via the Professional Dashboard. On TikTok, you can explore niche-specific hashtags or check out the "Suggested for you" section on similar profiles.
But don’t limit yourself to just direct competitors. Dividing your competitors into three categories can help focus your analysis:
| Competitor Type | Who They Are | Why Track Them |
|---|---|---|
| Direct | Same product/service, same target market | Helps you benchmark core performance metrics |
| Indirect | Different product, overlapping audience | Reveals content gaps and audience interests |
| Aspirational | 2–5× your size within your niche | Highlights scalable content ideas and growth trends |
This structured approach makes it easier to collect data and draw actionable insights. Avoid comparing yourself to celebrity accounts, though. Their reach is driven by entirely different algorithmic factors, which can skew your analysis.
Once you’ve identified your direct competitors, narrow the list to accounts you can consistently measure.
Building a Short Competitor List
Keep your list manageable - stick to 3–5 direct competitors and 2 aspirational accounts. Tracking too many profiles can create unnecessary noise, making it harder to act on the data.
Before finalizing your list, ask yourself one key question: can I consistently measure this account? Exclude private profiles, accounts that don’t align with your tracking tools, or those with inconsistent activity. Brands that focus on a well-curated competitor list see 40–60% higher engagement because their strategies are rooted in reliable data, not guesswork.
Step 2: Choose the Engagement Metrics To Track
Once you've finalized your competitor list, the next move is deciding which metrics to monitor. Focus on metrics that are consistent, comparable, and actionable - those are the ones that matter.
Core Metrics: Likes, Comments, Shares, and Saves
When it comes to Instagram and TikTok, four key metrics - likes, comments, shares, and saves - are your starting point. But keep in mind, these metrics carry different levels of importance depending on the platform.
- Likes: The simplest metric, showing basic interest, but it doesn’t always reflect deeper engagement.
- Comments: A stronger signal of engagement, as they encourage interaction and discussion. On Instagram, comments are weighted three times more than likes in the 2025–2026 algorithm. This means fewer likes but more comments could indicate better content performance.
- Shares: A vital metric on both platforms, as they signal content with "social currency" - content that people feel compelled to share. TikTok especially emphasizes shares, weighting them about three times higher than likes.
- Saves: A measure of how valuable the content is. On Instagram, saves are becoming increasingly important for driving distribution, alongside shares.
The platforms also differ in what drives reach. Instagram prioritizes follower engagement and retention signals, while TikTok focuses on watch time and completion rates. For TikTok, a completion rate of around 70% is the tipping point for content to go viral. In other words, videos that don’t hold viewers’ attention won’t get pushed further.
"A KPI belongs in competitor benchmarking only if you can measure it consistently, it's comparable across accounts, and it has a clear 'lever' you can pull." - Gabriela Holthausen, Social Media Specialist
Separate post-level data from account-level data for a clearer picture. Use median values from the last 20–30 posts to evaluate both individual posts and overall account performance. This approach helps eliminate distortions caused by one-off viral successes.
How To Calculate Engagement Rate
Raw metrics like total likes or comments don’t tell the full story. A large account will naturally rack up more likes than a smaller one, but that doesn’t necessarily mean their content is better. Engagement rate (ER) levels the playing field by converting raw numbers into a percentage, making comparisons fair across accounts of all sizes.
Here are the key formulas:
| Formula | Calculation | Best Use Case |
|---|---|---|
| ER by Followers | (Total Engagements / Total Followers) × 100 | Comparing creators; provides a stable baseline |
| ER by Reach (ERR) | (Total Engagements / Reach) × 100 | Organic posts; measures interactions among those who saw the content |
| ER by Views | (Total Engagements / Video Views) × 100 | Evaluating TikTok videos |
For Instagram, ER by Reach (ERR) is often the most accurate for organic content, as it reflects how people engage after seeing a post. On TikTok, ER by Views is the go-to metric because views are the primary reach indicator.
To illustrate, in early 2026, the TikTok account @joincheckmate posted a video about perfume refills. It hit a 10.86% engagement rate, calculated from 1,300,000 likes, 1,991 comments, 18,400 shares, and 189,900 saves against 13,900,000 views. This serves as a strong example of high-performing content at scale.
For context, average brand engagement rates in 2026 range from 0.30%–0.48% on Instagram and 1.5%–2.01% on TikTok. If a competitor consistently outperforms these benchmarks, it’s worth investigating what’s driving their success.
"A creator with 50,000 followers and an 8% engagement rate will almost always deliver better campaign results than a creator with 2 million followers and a 1% rate." - Influencer Marketing Factory
Step 3: Collect Data From Instagram and TikTok
Now that you've nailed down your key metrics, it's time to gather the data. The approach you take will depend on the number of competitors you're analyzing and how detailed you want to get.
Using Platform Analytics and Third-Party Tools
Instagram's Competitive Insights tool, available in the Professional Dashboard, is a great starting point. If you have a Business or Creator account, you can track up to 10 competitors and compare follower growth, posting frequency, and individual post performance over 30, 60, or 90 days. It's free, and the only setup required is switching to a Professional account.
That said, Instagram's native tools have their limits. They won't show you engagement rates, saves, shares, or Story performance for competitors. To fill these gaps, third-party tools like StoryChief, Metricool, and Socialinsider can provide deeper insights and automate reporting. TikTok's analytics for competitors are even more limited, making third-party tools a must for tracking performance across platforms.
For additional insights, take advantage of the Meta Ad Library. It's free and lets you see every active ad a competitor is running, including details like the creative format, copy, and call-to-action. Ads running for 90+ days are often a strong indicator of high-performing content.
"What organic content tells you is what earns attention. What ads tell you is what the brand has decided is worth paying for - i.e., what's converting." - CreatorHouse
Setting Up a Consistent Data Collection Process
When it comes to data collection, consistency is more important than precision. If you're pulling data on random days or using inconsistent timeframes, your comparisons won't hold up. Stick to a fixed 30-day window for your analysis.
Use medians instead of averages. A single viral post can skew an account's average reach or engagement, making it appear more successful than it really is. By focusing on median values from the last 20–30 posts, you'll get a clearer sense of a competitor's typical performance. Also, normalize the data by followers or format - a competitor with a much larger audience will naturally have higher raw numbers, but their reach-per-follower might actually be lower than yours.
Make it a habit to export key metrics like follower growth, monthly posts, Reels, and boosted content counts into a spreadsheet every 30 days. Over time, this will help you spot trends and seasonal patterns that one-off snapshots can't reveal. This consistent approach lays the groundwork for a more detailed competitor analysis in the next step.
Step 4: Analyze and Compare Competitor Engagement Patterns
Now that you've organized and normalized your data from Step 3, it's time to dig into the details. The goal here is to uncover why some competitors are excelling and pinpoint specific engagement trends. This step builds directly on the structured data you’ve already gathered.
Finding Patterns Across Competitors
Start by organizing your competitors' posts based on format - Reels, carousels, and single images. It's important to analyze engagement rates for each format separately. Why? Because mixing formats can distort your results. For instance, carousels tend to generate 1.4x more reach on Instagram compared to other formats. So, if a competitor leans heavily on carousels, their reach might look impressive, even if their Reels aren’t performing well.
Once you’ve sorted posts by format, look for these four key gaps:
- Distribution gap: High engagement from followers but limited reach to non-followers.
- Value gap: Good reach but low saves and shares per 1,000 followers.
- Conversion gap: Strong reach but minimal follower growth per post.
- Output gap: High engagement per post but low overall reach due to inconsistent posting.
By identifying these gaps, you can determine each competitor's strengths and where your own strategy might need adjustment.
Another factor to consider is creative repeatability. This refers to how often a competitor reuses a proven content format. For example, if they consistently post a "Monday form check" Reel that performs well, it suggests they’ve developed a scalable content model.
Using Visual Comparisons to Spot Differences
Once you've grouped posts and identified performance gaps, visual comparisons can help confirm trends. Tables are especially useful for side-by-side comparisons. Here’s an example of what a benchmark table might look like:
| Metric | Your Account | Competitor A | Competitor B |
|---|---|---|---|
| Reach-per-follower | 18% | 24% | 11% |
| Saves per 1,000 followers | 4.2 | 7.8 | 2.1 |
| Shares per 1,000 followers | 1.9 | 3.4 | 0.8 |
| Follower growth per 10 posts | +210 | +480 | +95 |
Here, Competitor A stands out with higher value density (saves) and better conversion (follower growth). This highlights a potential value gap in your metrics. Meanwhile, Competitor B may have a larger audience, but their low efficiency shows that a big following doesn’t always mean strong content performance.
To track trends over time, sparkline charts in tools like Google Sheets or Looker Studio can be incredibly helpful. These charts show how engagement or follower growth evolves week by week. If you notice a sudden spike in a competitor’s metrics, dig deeper. Was it a viral post, a giveaway, or a boosted Reel? Understanding these shifts can offer insights into what strategies work - and why.
Step 5: Build a Repeatable Engagement Tracking System
Once you've identified competitor engagement trends, the next step is to create a system that keeps tracking consistent and ongoing. Regular monitoring is essential to maintain and grow your competitive edge.
Setting a Regular Tracking Schedule
Divide your tracking into three intervals, each with a specific purpose. A weekly light check (15–30 minutes) helps you quickly catch shifts like new content trends, changes in posting frequency, or popular audio. A monthly deep review gives you time to adjust your strategy by revisiting key performance indicators (KPIs), updating your baseline metrics, and analyzing the most successful content formats. Finally, a quarterly review allows you to update industry benchmarks since algorithms and user behaviors can shift over time.
| Frequency | Time | Focus |
|---|---|---|
| Weekly | 15–30 minutes | Identify new trends, hooks, and shifts in posting patterns |
| Monthly | 1–2 hours | Reassess KPI targets, update baseline metrics, and analyze top formats |
| Quarterly | Half day | Refresh industry benchmarks and align with long-term goals |
Gabriela Holthausen, a social media specialist, emphasizes the importance of balance:
"If you run it daily, you'll overreact to normal variance; if you run it quarterly, you'll miss shifts in content strategy."
Using median figures keeps your analysis clear and consistent. Sticking to a structured schedule not only saves time but also lays the groundwork for automating key insights.
Using Outfame for Real-Time Analytics
Manual tracking can be time-consuming, often requiring 2–4 hours per session, which detracts from time spent on strategy. Automating this process can make a huge difference. Brands that use AI-powered tools for competitor analysis report 40–60% higher engagement rates, as these tools help fine-tune strategies with proven data. In fact, about 64% of marketers now rely on AI tools for competitor monitoring.
Outfame is designed to handle ongoing analytics effortlessly. Its 24/7 real-time monitoring and user-friendly dashboard provide instant insights into engagement trends, eliminating the need for manual data pulls. This not only saves time but also creates a long-term data archive - essential since many platforms only store analytics for 90 days. With plans starting at $39/month, Outfame also offers a free trial and guarantees growth, making it a valuable tool for refining your data-driven strategy.
Conclusion: Turning Insights Into Action
Tracking competitor engagement metrics isn't about obsessing over others - it's about using solid data to make smarter decisions for your content and growth strategies.
Key Takeaways
The process boils down to four essential steps: identify the right competitors, focus on metrics that guide specific actions, gather data consistently, and track patterns over time. Raw numbers like total likes or follower counts can be misleading. Instead, focus on normalized metrics for fair comparisons and use median values to avoid skewing results due to viral outliers. Also, compare competitors within the same content format (e.g., Reels vs. carousels), as different formats naturally perform differently. Brands that incorporate structured analysis into their strategies report 40–60% higher engagement rates compared to those relying on guesswork.
These insights provide a roadmap for refining and improving your content strategy.
Next Steps for Growing Your Audience
Begin by identifying your biggest performance gap. Use your tracked data to determine where you’re falling short - whether it’s in distribution, value, or conversion. For example:
- Are you struggling to expand your reach (distribution gap)?
- Not seeing enough saves or shares (value gap)?
- Experiencing high reach but slow follower growth (conversion gap)?
Each type of gap points to a different solution, and competitor data can help you zero in on the specific areas to prioritize.
As Jason Miller, Chief Growth Officer at Aibrify, explains:
"Consistently posting without competitor insights is like driving blindfolded. You might be heading in the right direction, but you'll never know where the real opportunities are."
Make it a goal to set up a tracking routine this week. A quick 15–30 minute check every week is enough to stay ahead of trends and shifts. And if manual tracking feels overwhelming, tools like Outfame’s real-time analytics and 24/7 monitoring can simplify the process, freeing up your time to focus on acting on those insights.
FAQs
How many competitors should I track?
Tracking 3 to 10 competitors is the sweet spot for benchmarking engagement metrics. This range strikes a balance - offering enough data for meaningful comparisons without overwhelming your analysis. Focusing on fewer, relevant competitors helps you maintain clarity and ensures your efforts remain impactful. Trying to monitor too many accounts can spread your attention too thin, so prioritize quality over quantity when choosing who to track.
Which engagement rate formula should I use for Instagram vs. TikTok?
For Instagram, calculate engagement by using (Likes + Comments + Shares + Saves) ÷ Followers × 100 for a quick overview. For a more precise measure, use ÷ Reach × 100 instead. On TikTok, engagement is best measured at the video level with ÷ Views × 100, as views align closely with the platform's algorithm. For broader profile comparisons, you can use ÷ Followers × 100 on both platforms, though it may not be as accurate for TikTok.
How do I avoid viral posts skewing competitor benchmarks?
To ensure competitor benchmarks remain accurate and avoid distortion from viral posts, prioritize median metrics such as median reach and engagement rate per post. Steer clear of relying on outliers or unusually high-performing content. Instead, normalize data based on posting volume to make fair comparisons. This method provides a clearer picture of typical engagement levels, keeping benchmarks consistent and reliable.


